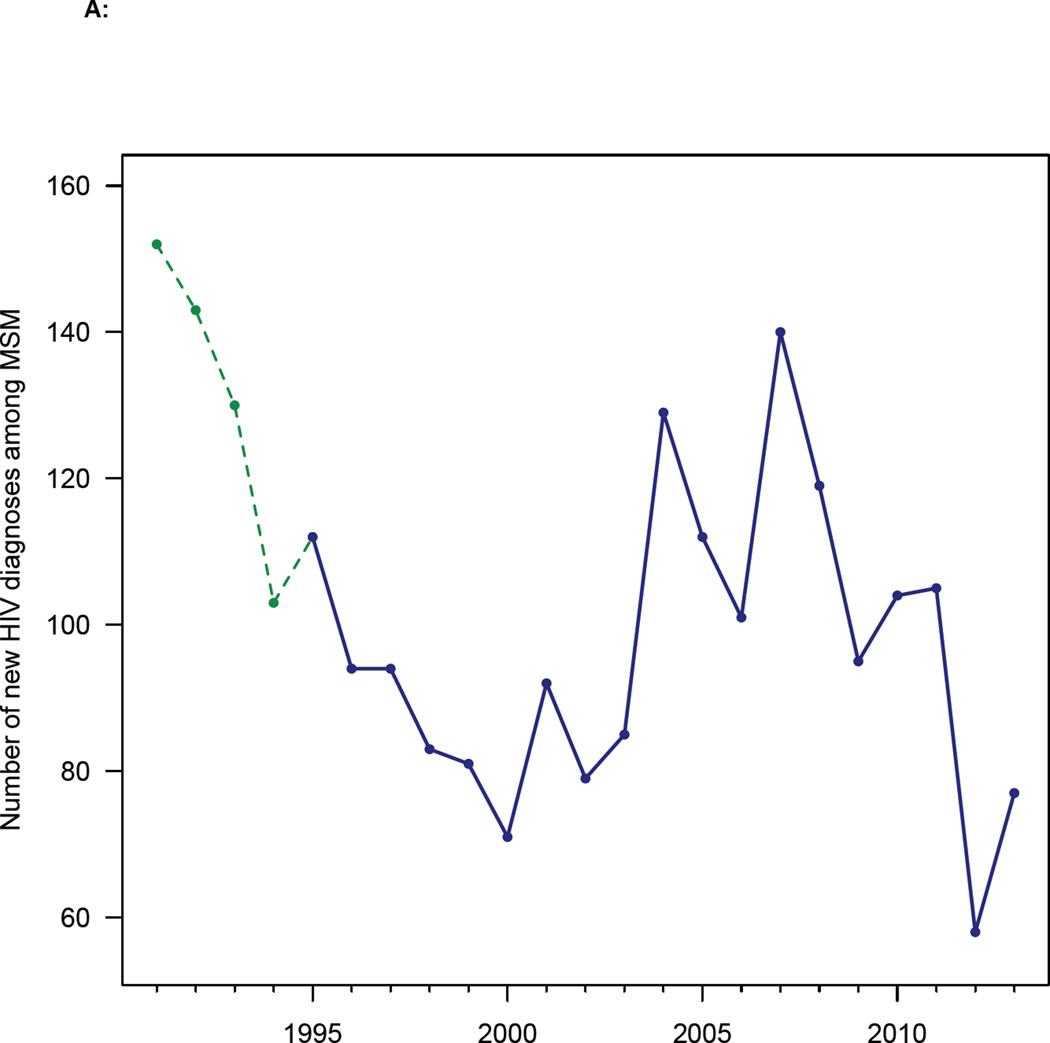
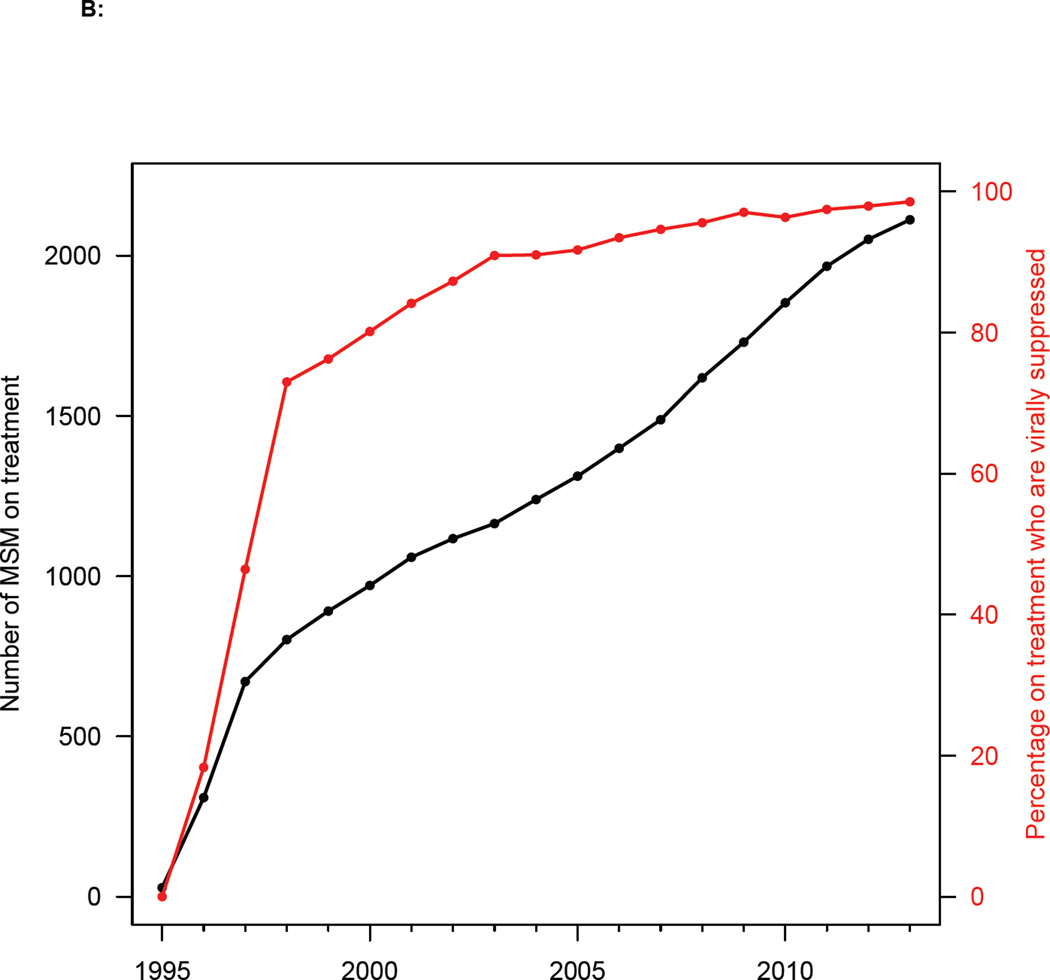
Figure 1. Temporal trends in diagnosis and treatment rates.
(A) HIV diagnosis rates for all MSM diagnosed with HIV infection in Denmark between 1991 and 2013. Green dashed line shows national surveillance data and blue solid line shows Danish HIV Cohort Study (DHCS) data. (B) Uptake of treatment (black line), and increase in viral suppression rates (red line) after the introduction of combination therapies in 1996 (DHCS data). Data from all MSM treated in Denmark from 1995 to 2013.


