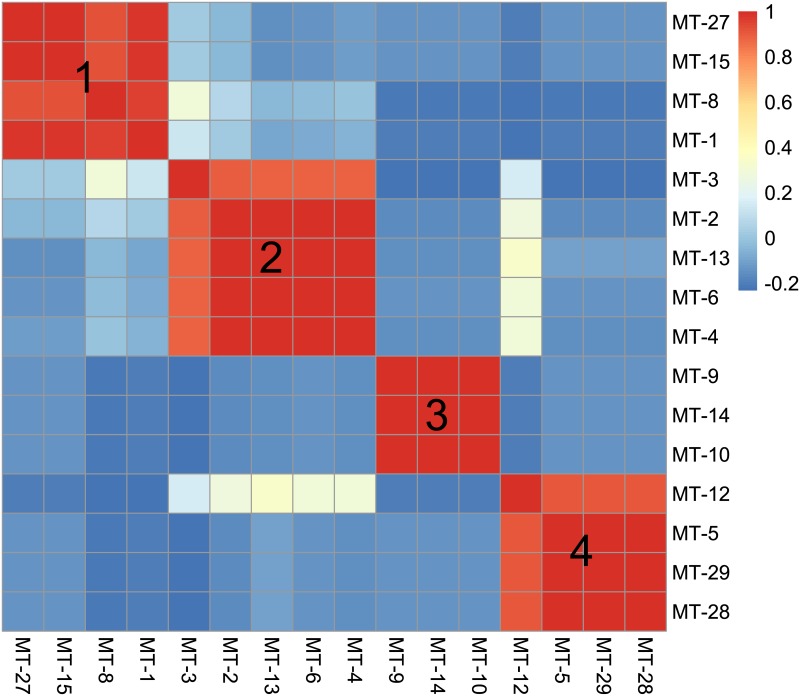
Fig 1. The heatmap representing host niche similarity measured as correlation between population log-densities of particular wheat curl mite (WCM) lineages on grass host species.
Correlation coefficient is expressed with colors explained on the scale on the left. Numbers indicate the groups of WCM lineages that clustered according to host associations (1- with cereals, 2 –with quackgrass, 3 –with smooth brome, 4 –with tall oat-grass).

