
Figure 2. SFA treatment preferentially induces adaptive, but not terminal, IRE1α signaling in both mouse and human macrophages.
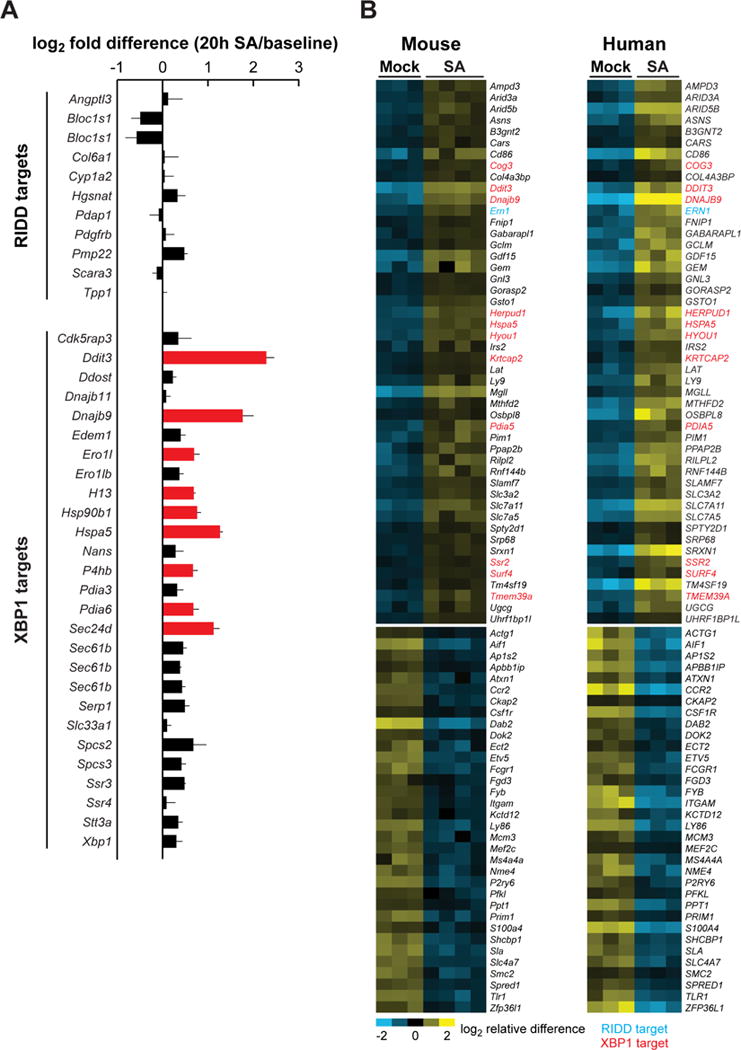
(A) Changes in the expression level of genes associated with the adaptive UPR (XBP1 targets) and the terminal UPR (RIDD targets). Differences between the average log2 expression values for each sample group are shown, with red bars indicating significantly up-regulated genes. Error bars, SD. (B) Heat map, showing the genes significantly up- or down-regulated in response to SA in both mouse BMDMs (this study, 20 h treatment) and human monocyte-derived macrophages (reanalysis of data from Xue, et al. 2014, 24 h treatment). XBP1 targets are shown in red and RIDD targets in blue. See also Figure S2.