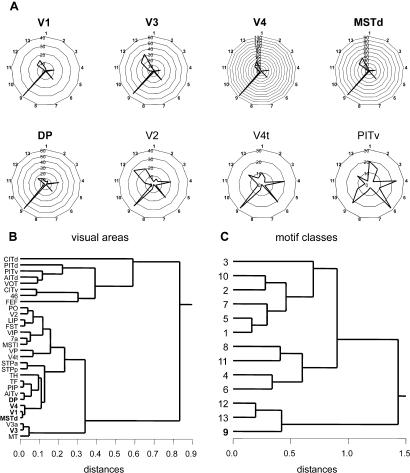
Figure 4. Motif Fingerprints for Motif size M = 3 in Macaque Visual Cortex.
(A) Motif fingerprints for five areas with significantly increased motif ID = 9 (V1, V3, V4, MSTd, DP, names in bold) as well as areas V2, V4t, and PITv. Polar plots display the motif participation number for 13 motif classes with M = 3 (see Figure 1). Note that, despite differences in the absolute motif participation numbers, areas V1, V3, V4, MSTd and DP show highly similar motif fingerprints.
(B) Hierarchical cluster analysis of motif fingerprints. The Pearson correlation coefficients between all pairs of motif fingerprints were used in a consecutive linking procedure using Euclidean distances based on the farthest members of each cluster (for details see Kötter and Stephan [2003]). Areas with more similar motif fingerprints are linked at smaller distances. The five areas with significantly increased motif ID = 9 are indicated in bold typeface.
(C) Hierarchical cluster analysis of single area motif frequency spectra using the same procedures on orthogonal data of (B). Motif classes 9, 12, and 13 covary across the 30 visual areas and form a distinct branch of the cluster tree.

