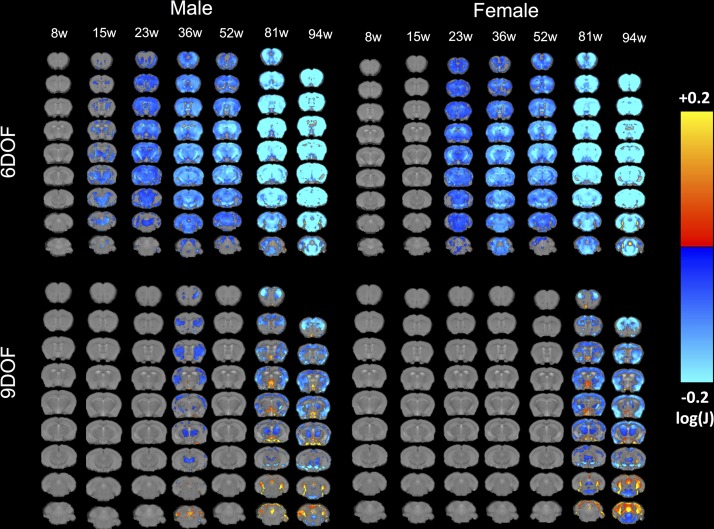
Fig 6. TBM Group comparison at each time point.
Maps of local volumetric changes in male and female WT compared to HdhQ150 mice revealed significant sub-regional changes. Images are presented either as global volume changes (6 degrees of freedom, DOF) or region-specific changes which account for whole brain differences (9DOF). Color scales represent statstically significant volume hypertrophy (warm colors) or atrophy (cold colors) with only voxels surviving correction for multiple comparisons (False Discovery Rate with q<0.05) being shown. Early atrophy in the striatum and motor cortex is evident before other regions are gradually affected. It is also evident here that 6DOF reveals more dramatic changes which potentially indicates overall brain growth related effect as compared to region-specific effects as revealed in the 9DOF.

