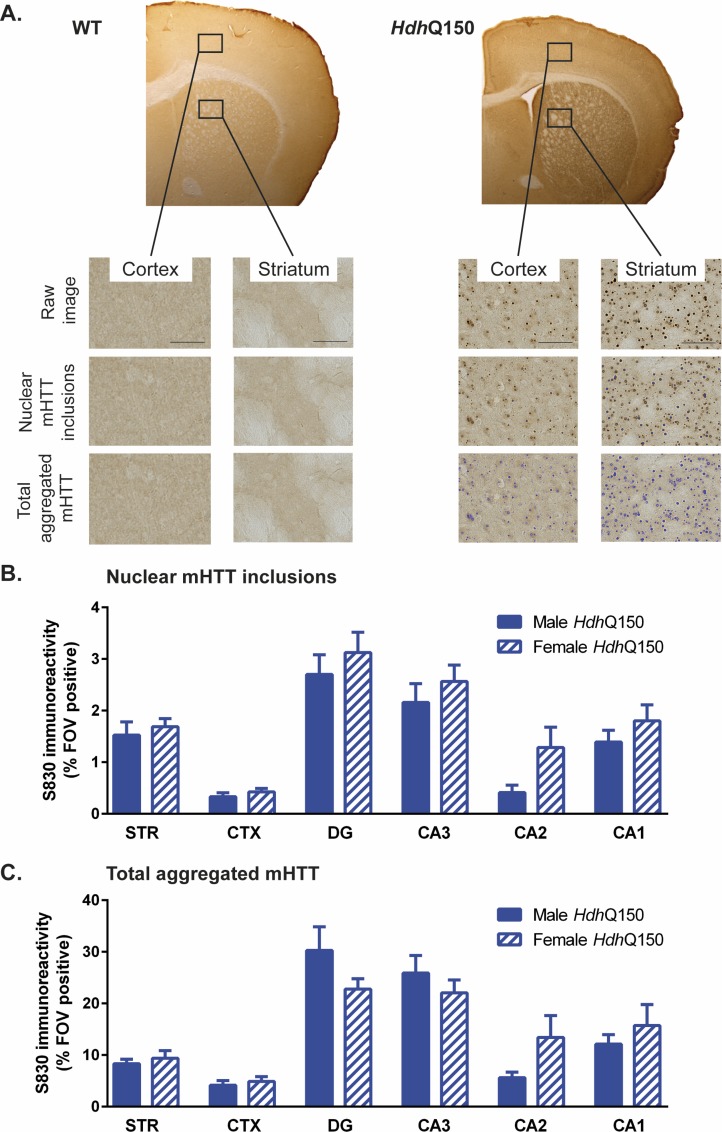
Fig 9. mHTT accumulation in HdhQ150 mice.
(A) Sample S830-stained brain sections of a WT and HdhQ150 mouse. Threshold-intensity-based analysis was used to descriminate nuclear mHTT inclusions versus total aggregated mHTT levels in the striatum (STR), cortex (CTX), dentate gyrus (DG), hippocampal CA3 subfield (CA3), hippocampal CA2 subfield (CA2) and hippocampal CA1 subfield (CA1). There were no significant differences in mHTT levels between male and female HdhQ150 mice in the regions investigated. All data presented as means ± SEM.

