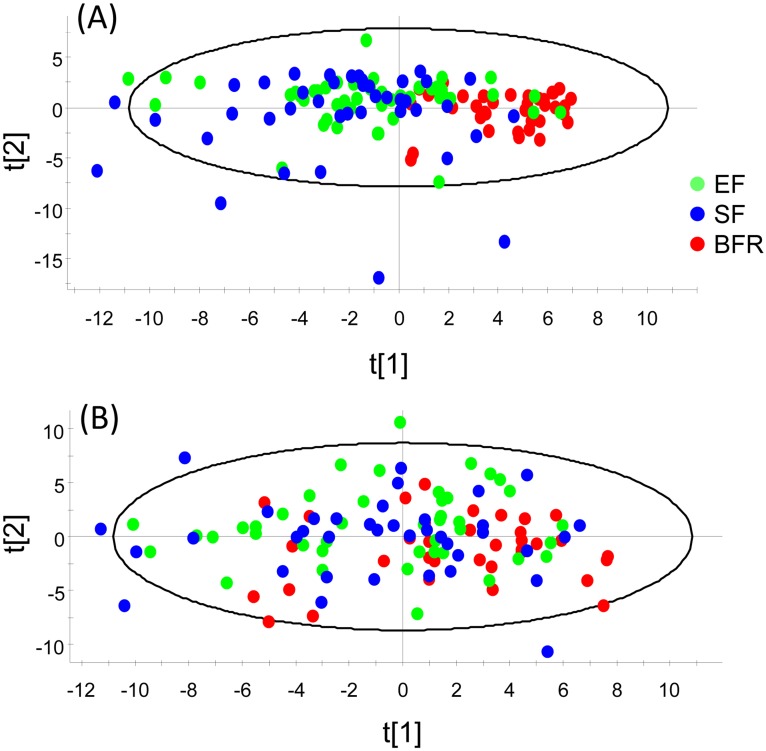
Fig 4. PCA score plot.
The figure provides a map of how infants relate to each other by feeding type based on a model including genera and species/phylotypes identified by HOMD blasting after exclusion of OTUs with <15 sequences, sex, mode of delivery, anthropometric measures, and lactobacilli by culture at (A) 4 months and (B) 12 months of age. t1 and t2 are scores for the new PCA created variables summarizing the x variables. Each observation has a t1 and t2 value.

