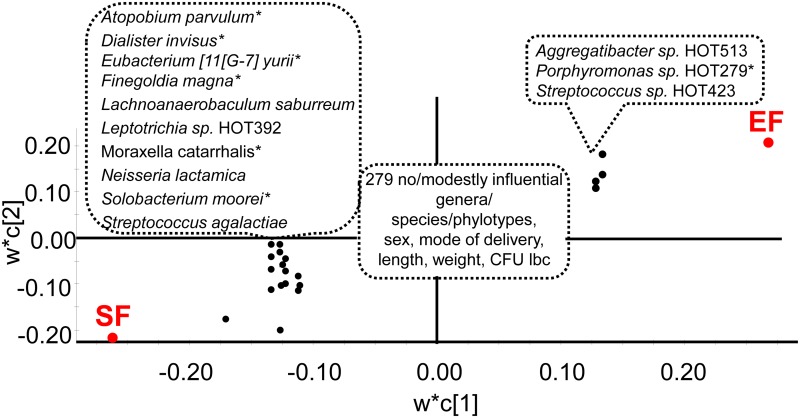
Fig 7. PLS loading scatter plot with being in the EF or SF group as dependent variables.
The model included genera and species/phylotypes identified by HOMD blasting after exclusion of OTUs with <15 sequences, sex, mode of delivery, anthropometric measures, and lactobacilli by culture as the independent block. w describes the PLS weights from the combination of the original variables in the X-swarm and c the same for the Y-swarm. Taxa with a statistically significant PLS correlation coefficient ≥0.1 are indicated. * after a taxa denotes that the corresponding genus was influential. For full list and univariate p-values see S1 and S2 Tables.

