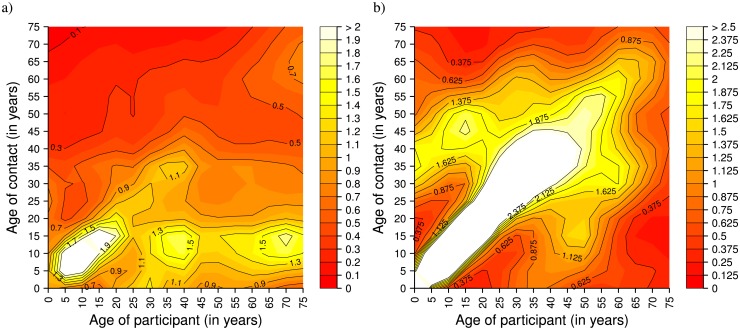
Fig 3. Comparison between social contacts in Manicaland (Zimbabwe) and in Italy.
a) Social contact matrix derived for Manicaland (Zimbabwe), 2013, considering all reported contacts and applying bivariate smoothing. The matrix shows the average number of contacts during working days (weekends and school holidays are excluded) of participants in the i-th age group with individuals in the j-th age group. b) As a), but for Italy (data from the POLYMOD study [4], weekends excluded).

