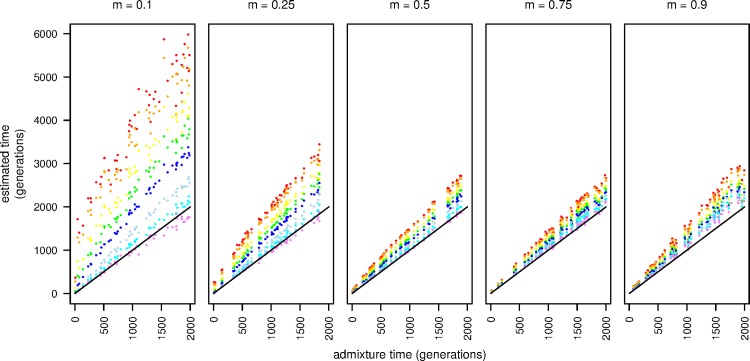
Fig 1. The effect of increasing stringency with ancestral LD pruning.
From left to right, ancestry proportions are 0.1, 0.25, 0.5, 0.75 and 0.9. |r| cutoffs are: none (red), 1.0 (orange), 0.9 (yellow), 0.8 (green), 0.7 (dark blue), 0.6 (cyan), 0.5 (indigo), and 0.4 (violet). The solid line indicates the expectation for unbiased time estimation. All read data were simulated with ploidy = 1. True admixture time was drawn from a uniform (0, 2000) distribution.

