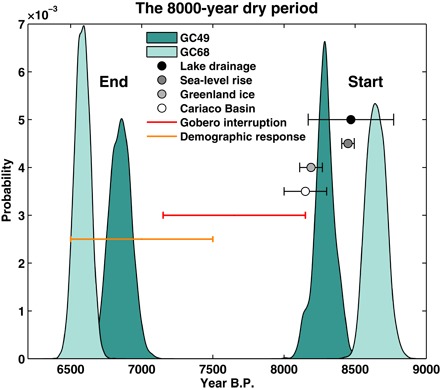
Fig. 4. The 8 ka pause in Green Sahara conditions.

Green areas denote the probability distributions of the start and end of the 8 ka dry period at sites GC49 (23°N) and GC68 (19°N), on the basis of the inferred locations in the core (from bioturbation modeling) for an abrupt beginning and end, and Monte Carlo iteration of age model uncertainties. Black and gray dots with error bars represent the mean and 1σ ages for climatic events associated with the 8.2 cooling event in the Northern Hemisphere, including (i) the timing of the drainage of Lake Agassiz and Lake Ojibway (37); (ii) the timing of an abrupt rise in sea level, detected in the Netherlands (62); (iii) the duration of the 8.2 event in the Greenland ice cores (38); and (iv) the duration of the response in Cariaco Basin grayscale data (63). Shown in red is the timing and duration of a prolonged interruption in the occupation of the Gobero site by humans (31). The yellow bar indicates a Sahara-wide demographic decline (32).
