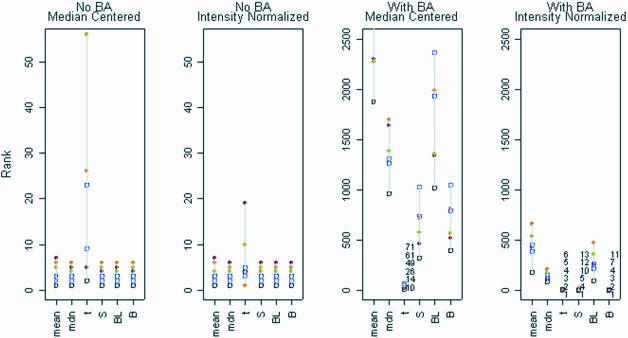
Figure 2.
Rank of spike-in genes according to the absolute value of the statistics for the four versions of Dataset D (GenePix®). The ideal ranking is 1-2-3-4-5-6. Colors differentiate the different genes—solid circles are for the three genes with ratio 3 and hollow squares are for the three genes with ratio 1/3. BA, background adjustment. Notice the substantial scale change between the plots for the data with and without BA, indicating worsened ability to detect differentially expressed genes in the BA data.

