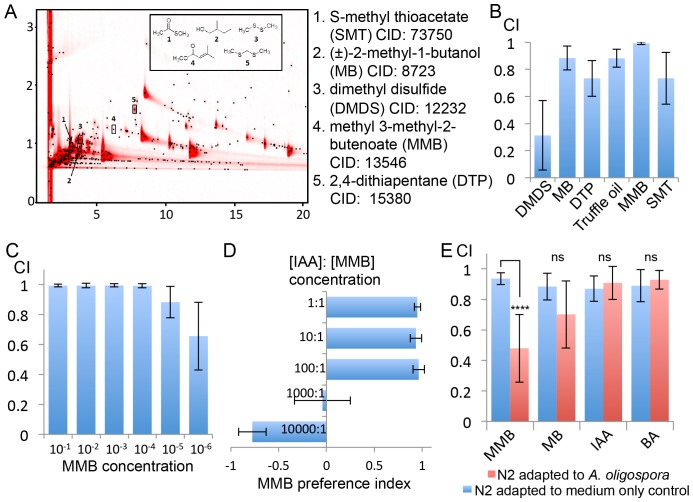
Figure 3. GC x GC-TOFMS analyses identified A. oligospora-derived odorants that are attractive to C. elegans.
(A) Representative two-dimensional gas chromatogram obtained from SPME sampling of headspace above A. oligospora cultures. The total detector response is indicated by the intensity of red in the chromatogram. Black dots represent discrete elution peaks identified during data processing (shown for a signal-to-noise threshold of 100). The elution peaks labeled 1–5 represent compounds that were detected only in A. oligospora cultures, and not in the medium-only controls. (B) Chemotaxis assays of A. oligospora-derived odorants. Chemicals were tested at a 10−2 dilution and truffle oil was tested undiluted (Mean ± SD, n = 6 trials). (C) N2 adults were strongly attracted to MMB across a wide-range of concentrations (Mean ± SD, n = 6 trials). (D) C. elegans prefers MMB over isoamyl alcohol (IAA; Mean ± SD, n = 3–7 trials). The MMB preference index was calculated according to the formula in Figure 1. (E) Chemotaxis plot showing C. elegans chemotactic response to different odorants after 2 hr adaptation to A. oligospora culture (red) or the medium-only control (blue; Mean ± SD, n = 4–10 trials).

