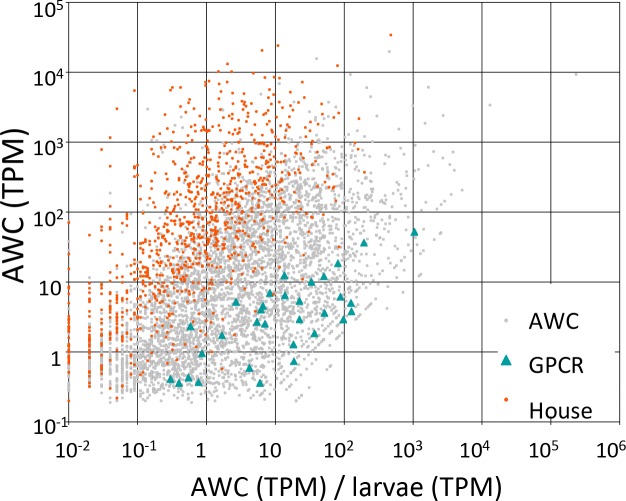
Data columns are as follows.
Gene: a given predicted protein-coding or ncRNA-coding gene in the
C. elegans genome, from WormBase release WS245, for which we observed non-zero gene activity in AWC neurons. All further data columns are pertinent to that particular gene.
AWC: the expression level for a given gene in AWC neurons, generated from a pooled set of all AWC RNA-seq reads, measured in TPM.
Larvae: the expression level for a given gene in whole larvae, generated from a pooled set of all larval RNA-seq reads, measured in TPM.
AWC/larvae: the ratio of gene expression (measured in TPM) between AWC neurons and whole
C. elegans larvae. Genes in this table have been ranked by descending values of AWC/larvae, as a general measure of their AWC-specificity.
AWC.vs.larvae_padj: the statistical significance (if any) with which a given gene was expressed either more or less strongly in AWC neurons than in larvae. Significance is given as a p-value, adjusted for multiple testing (hence, named ‘padj’) by the collective false discovery rate (FDR) formula of Benjamini and Hochberg (
Benjamini and Hochberg, 1995). To compute this set of padj values, we compared mapped reads per gene from two biologically independent sets of single-cell AWC RNA-seq data (set 1, cells 1, 2, and 4; set 2, cells 3 and 5) to mapped reads from two pools of whole
C. elegans larvae (
Supplementary file 2). Significance was calculated with DESeq2 (
Love et al., 2014) using default arguments to optimize the number of genes detected with a padj of ≤0.01.
AWC_minTPM: the minimum expression level for a given gene in AWC neurons at a credibility interval of 99%, generated from a pooled set of all AWC RNA-seq reads (
Supplementary file 2), measured in TPM.
Larvae_minTPM: the minimum expression level for a given gene in whole larvae at a credibility interval of 99%, generated from a pooled set of all larval RNA-seq reads (
Supplementary file 2), measured in TPM.
AWC_cell_[number]_TPM: the expression level for a given gene in a single AWC neuron (number 1 through 5), generated from the specific set of AWC RNA-seq reads from that individually dissected and amplified neuron (
Supplementary file 2), measured in TPM.
AWC_cell_[number]_minTPM: the minimum expression level for a given gene in a single AWC neuron (number 1 through 5) at a credibility interval of 99%, generated from the specific set of AWC RNA-seq reads from that individually dissected and amplified neuron (
Supplementary file 2), measured in TPM.
Coding: the nature of a given gene's coding potential, as annotated in WormBase WS245. Most genes are either solely protein-coding or solely ncRNA-coding, and are noted as such in this data column. For 301 genes in
C. elegans, WS245 predicts both protein-coding and non-protein-coding transcripts; in this table, such genes are denoted with ‘protein; ncRNA’. However, for purposes of gene analysis, we assume that any gene with dual predicted nature is solely protein-coding.
Prot_size: this shows the full range of sizes for all protein products from a gene's predicted isoforms.
Max_prot_size: the size of the largest predicted protein product.
Housekeeping: a set of genes that we previously observed, by single-cell RNA-seq, to be consistently active both in whole
C. elegans larvae and in three different states of migrating
C. elegans linker cells (
Schwarz et al., 2012).
7TM_GPCRs: a set of genes encoding G-protein coupled receptors (GPCRs), a class of genes of particular biological interest in deciphering AWC function. Prominent members of this set include
dop-1,
gar-1,
lat-1,
odr-10, and
ser-2 (
Hobert, 2013).
Pfam-A: for protein-coding genes, predicted domains from the annotated (Pfam-A) subdivision of PFAM 27 (
Finn et al., 2014), PMID 24288371), with an E-value of ≤10
–5.
eggNOG: for protein-coding genes, predicted orthology groups from the eggNOG 3.0 database (
Powell et al., 2012).
Phobius: this denotes predictions of signal and transmembrane sequences made with Phobius (Käll et al., 2004). 'SigP' indicates a predicted signal sequence, and 'TM' indicates one or more transmembrane-spanning helices, with N helices indicated with '(Nx)'. Varying predictions from different isoforms are listed.
NCoils: this shows coiled-coil domains, predicted by ncoils (
Lupas, 1996). As with Psegs, the relative and absolute fractions of each protein's coiled-coil residues are shown.
Psegs: this shows what fraction of a protein is low-complexity sequence, as detected by pseg (
Wootton, 1994). Both the proportion of such sequence (ranging from 0.01 to 1.00) and the exact ratio of low-complexity residues to total residues are given. Proteins with no predicted low-complexity residues are blank.
GO_terms: this denotes Gene Ontology terms for which a gene was annotated in WormBase release WS245.

