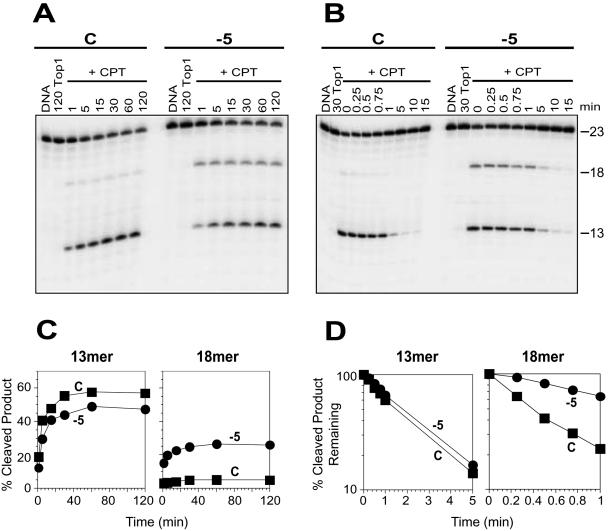
Figure 3.
Selective enhancement of CPT-induced trapping of Top1 at a secondary site by the N2-ethyl-dG adduct at the position −5. (A) Top1 reactions were carried out as in Figure 2A with the 3′-labeled unadducted (C) and adducted oligonucleotide (−5) in the absence of drug for 120 min (120 Top1) or in the presence of 1 μM CPT (+CPT) at 25°C for the indicated times (min). (B) Using the same oligonucleotides as in (A), the reactions were carried out with Top1 at 25°C for 30 min in the absence (30 Top1) or in the presence of 1 μM CPT (+CPT). Reactions were stopped before (0) and after reversal at 25°C for the indicated time periods (min). Numbers 23, 18 and 13 indicate the size of the 3′-labeled oligonucleotide substrate and the Top1-mediated DNA fragments induced by CPT, respectively. (C) CPT-induced Top1-mediated 13 and 18mer cleavage products obtained using control (square) and adducted −5 (circle) oligonucleotides from (A) were quantified and represented graphically. (D) Reactions carried out in (B) were quantified and the percentage of CPT-induced Top1-mediated 13mer and 18mer cleavage products remaining after salt reversal at 25°C in the control (square) and adducted −5 (circle) oligonucleotides were represented as semi-log plots. Values are normalized to the drug-induced cleavage product remaining at time 0 taken as 100%. Computation of the kinetic constants is shown in Table 2.

