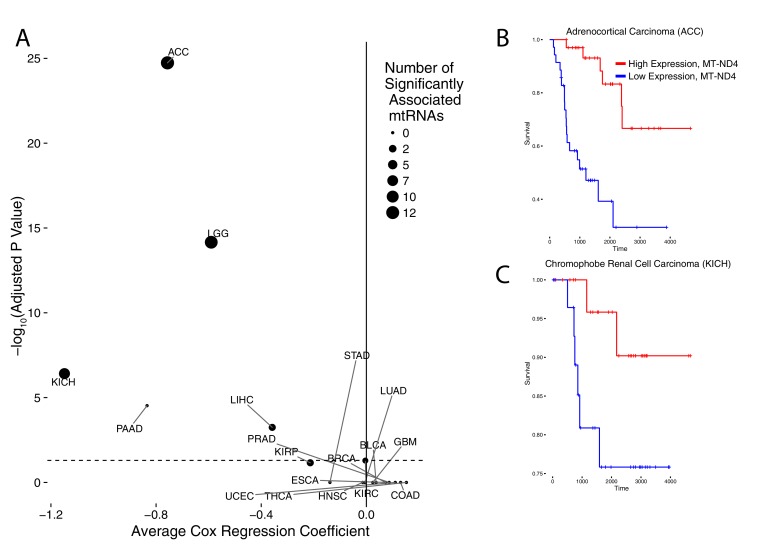
Figure 3. Association of mtRNA expression levels with overall survival across cancer types.
Multiple-hypothesis-adjusted univariate p-values from Cox regression for each mtRNA are combined using Fisher’s method for each cancer type. Several cancer types show an association between high mtRNA expression and improved outcome (negative Cox regression coefficient). Dashed line indicates threshold for statistical significance. Representative Kaplan-Meier plots are shown for overall survival in ACC (B) and KICH (C), partitioning patients into high expression vs. low expression groups based on median expression of MT-ND4.

