. 2017 Jan 4;6:e22268. doi: 10.7554/eLife.22268

Figure 1. Expansion of the neuroblast delamination domain and formation of the SAG rudiment.

(a) Overview of the imaging and image processing strategy: inner ears of zebrafish embryos stained for cell membrane, nucleus and cell fate markers were imaged between 14-42 hpf. Image datasets were processed by nucleus center detection, cell tracking and cell shape segmentation. Data were validated and curated (Figure 1—figure supplement 1). (bd) Time-lapse stills showing the posterior expansion of the neuroblast delamination domain over time; 3D-rendering of segmented epithelial neuroblasts (green) in context of the otic structure (plasma membranes in magenta) at indicated times; insets display only the segmented delamination domain with the otic vesicle contour in white. ID Dataset: 140210aX; see Figure 1—figure supplement 2d for additional analyses. (eg) Time-lapse stills showing a segmented delaminating neuroblast (red; Video 2); (e’g’) magnifications of framed regions in (eg). ID Dataset: 140426aX. (hi) Still images from Video 1 displaying: otic tissue architecture (h), and cellular distribution (i) upon SAG formation. Reconstructed cell centers are color-coded according to cell position/identity (see legend). ID Dataset: 140423aX. SAG/ALLg, statoacoustic/anterior lateral line ganglia. AM/PM, anterior/posterior maculae.

DOI: http://dx.doi.org/10.7554/eLife.22268.003

Figure 1.

Figure 1—figure supplement 1. 3D+time image analysis pipeline.

Figure 1—figure supplement 1.

Information about plasma membranes, nuclei and cell fates was collected upon imaging the inner ears of zebrafish embryos for several hours (14-42 hpf; Table 1) under a Zeiss Lightsheet Z.1 microscope (3D+t SPIM imaging). The acquired data were preprocessed to generate the high-resolution datasets to be launched in BioEmergences platform (Faure et al., 2016; Olivier et al., 2010) for cell center detection and automatic tracking. Data were validated, curated and analyzed using an ad-hoc strategy based on Mov-IT, a custom-made graphical interface (Faure et al., 2016), which offers the tools for segmentation and tracking of cells to accurately reconstruct their positions, movements and divisions. The high-resolution datasets and reconstructed lineages were used for qualitative and quantitative studies of the indicated biological processes (Table 2). The cohort of embryos used in the study can be found in Table 1.

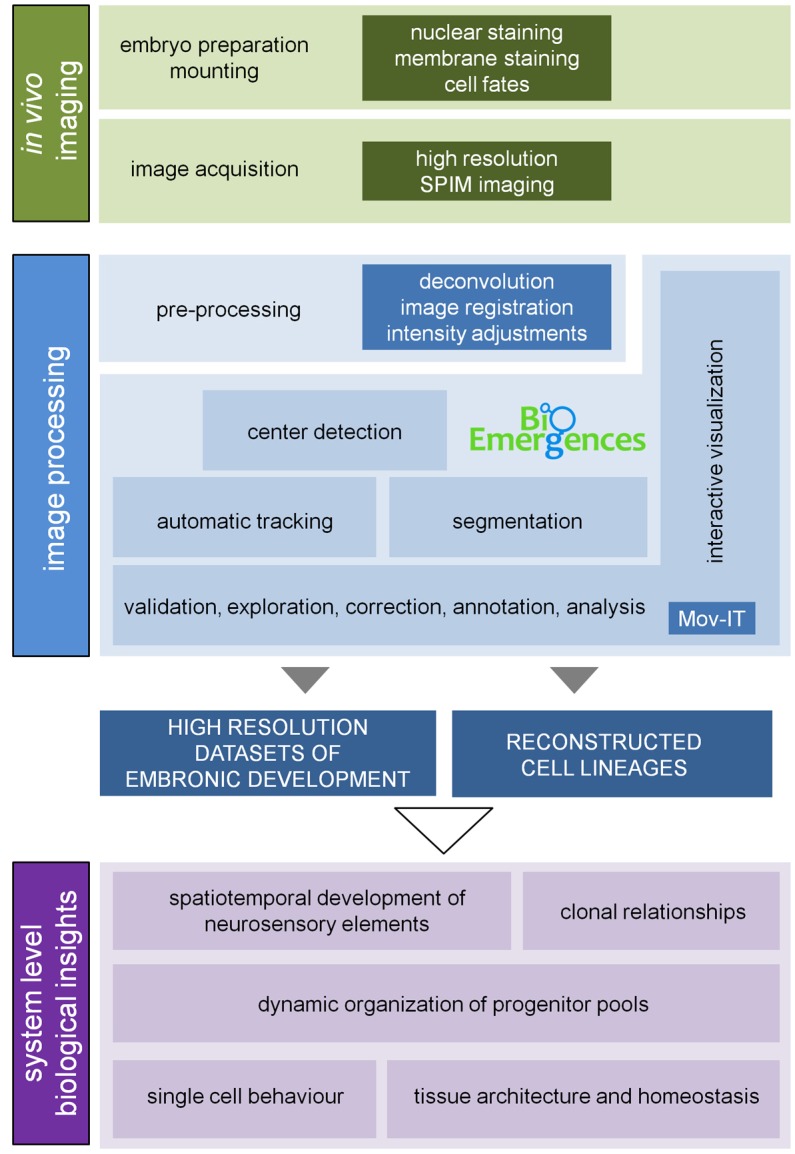
Figure 1—figure supplement 2. Posterior expansion of the otic neuroblast delamination domain.

Figure 1—figure supplement 2.

Tg[neuroD:GFP] embryos were injected with lyn-TdTomato mRNA at 1cell-stage and imaged from 14.5 hpf onwards. Embryos express GFP (green) in neuronal progenitors and differentiating neuroblasts, and TdTomato in all cell membranes (magenta). In the case of the inner ear, GFP is expressed in epithelial neuroblasts just prior to delamination and in the SAG neuroblasts. (ac) Still image views of the ventral otic vesicle at the indicated time points showing the quick expansion of the delamination domain in the otic epithelium within 2 hr from anterolateral to posteromedial regions; note that at this stage the rudiment of the adjacent ALLg is already visible. (a’c’) Transverse views are digital reconstructions along the lines indicated in (ac) and illustrate that the onset of neuroblasts’ delamination progresses from lateral to medial domains (see arrowheads). ALLg, anterior lateral line ganglion; SAG, statoacoustic ganglion; nt, neural tube. The otic vesicle contour is depicted in white. ID Dataset: 140210aX. (d) Plot depicting the posterior expansion of the neuroblast delamination domain as assessed by neuroD-GFP expression. The position of posterior-most neuroD-GFP expressing cells in the otic epithelium, and the anterior and posterior edge of the otic vesicle (dorsal view) were assessed over time (see scheme). The plot displays the position of posterior-most GFP epithelial cells as a percent of the AP otic vesicle length (ID datasets: 140306aX, 140125aX, 140210aX).