Figure 2. The organization of cells within the SAG relies on specific temporal and spatial cues.
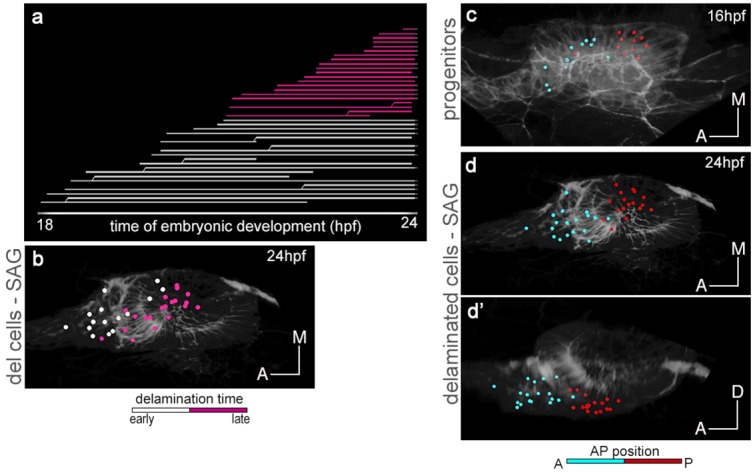
(a) Flat representation of the neuroblast lineage tree with branches indicating cell divisions. The x-axis displays the time of embryonic development in hours post-fertilization (hpf). Neuroblast lineages are displayed from the moment of delamination onwards and ordered and color-coded according to delamination timing (intervals: 18–20 hpf white, 20–22 hpf yellow, 22–24 hpf orange, 24–30 hpf red). Some cells were not tracked until the end of the sequence, and are depicted as interrupted lines. The extensive cell loss during the early stages of delamination (18–22 hpf) was verified in a second embryo; in both cases, about 25% (23.2% and 26.8%) of the otic epithelial cells at 18 hpf exit by delamination in the consecutive four hours. (c–c’,e–e’,g–g’) Neuroblasts within the SAG (n = 144 of roughly total n = 250) were backtracked to their progenitor state in the epithelium (n = 98; b,d,f; Videos 3 and 5). Cell lineages were color-coded for: time of delamination (b–c’; same intervals as in (a)), position in the epithelium along the AP (d–e’), or ML (f–g’) axes. Note that ML organization of neuroblasts within the SAG (c–c’) relies on their delamination order, and that the blue/white/red epithelial pattern (d–e’; neuroblasts AP position) but not the green/white/red one (f–g’; neuroblasts ML position) is maintained in the SAG over this time period (18–30 hpf). Reconstructed cell centers were displayed as colored-dots together with the corresponding raw images (plasma membranes in grey level). (b,d,f) dorsal views; (c,e,g) ventral views; (c’,e’,g’) lateral views. Anterior is always to the left. For this analysis, Tg[cldnb:lynGFP] Tg[Isl3:GFP] line was injected with H2B-mCherry mRNA at 1cell-stage (Tables 1–2). ID Dataset: 140426aX; see Figure 2—figure supplement 1 for additional analysis.

Figure 2—figure supplement 1. Time of delamination and position of epithelial neuroblasts prefigure their location within the SAG.