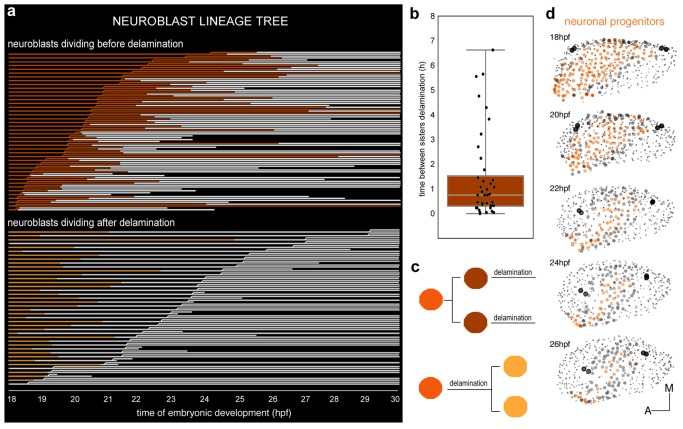
Figure 3. Clonal analysis of neuroblasts.
(a) Lineages of neuroblasts (epithelial: colored; delaminated: white) ordered by time of division and grouped according to the division behavior -dividing before (red, top) or after (orange, bottom) delamination. Each line corresponds to a single neuroblast. Discontinued lines represent cells that were not tracked further. The x-axis displays the corresponding time of embryonic development (hpf). (b) Box plot illustrating the temporal delay in delamination between sister cells (Figure 3—figure supplement 1d). (c) Illustration of neuroblast division behavior colored as in (a). (d) Dynamic map of neuronal progenitors (orange circles) and their epithelial neighboring cells (grey circles) in the context of the whole otic vesicle (grey dots) over time; see Video 8 for the 24 hpf animation. The color intensity of cell centers depicts the position of cells along the dorsoventral axis of the otic vesicle. The map was built after following the lineages from 18 hpf to 26 hpf of all encircled cells. Note how neuroblast delamination impacts on the size and position of the progenitor domain (orange cell centers) over time. Tether cells are depicted as black circles. For this analysis, Tg[cldnb:lynGFP] Tg[Isl3:GFP] line was injected with H2B-mCherry mRNA at 1cell-stage (Tables 1–2). ID Dataset: 140426aX.


