. 2017 Jan 4;6:e22268. doi: 10.7554/eLife.22268

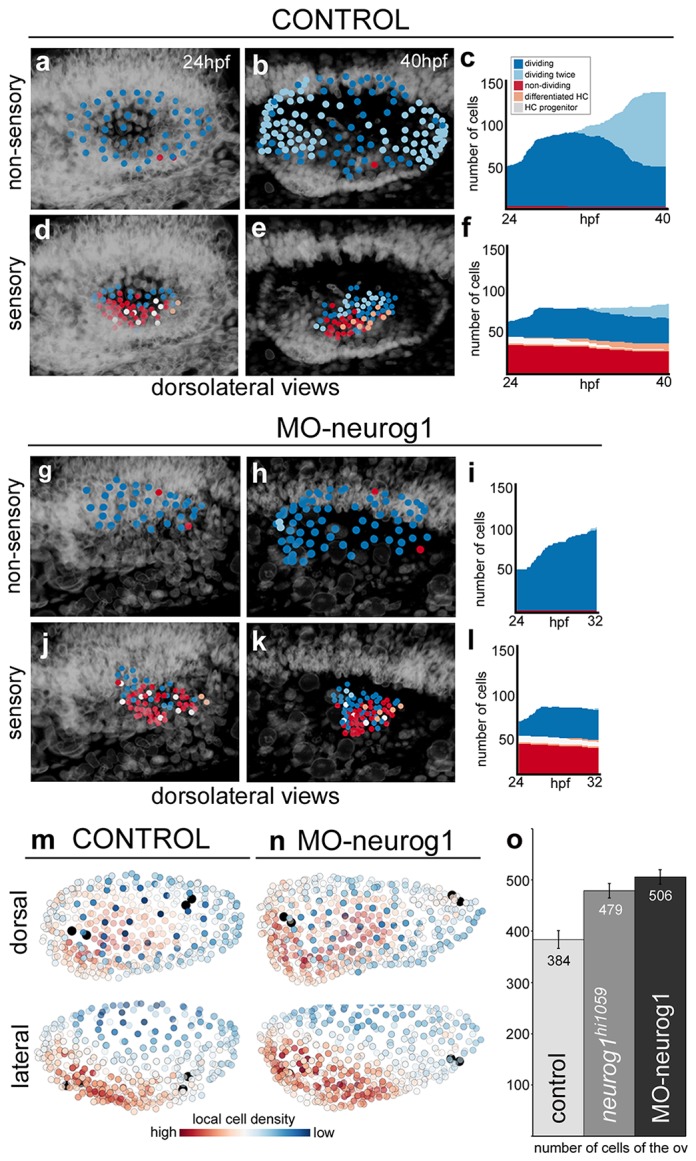
Figure 5. Heterogeneous cell behavior in the non-sensory and sensory domains.

Neighboring cells in the non-sensory and sensory domains of control (af) and MO-neurog1 (gl) were tracked and reconstructed cell centers were color-coded according to cell proliferation/differentiation status (see legend in (c); Video 9); they were plotted on the top of the corresponding raw images (a–b,d–e,g–h,j–k; nuclei in grey level), or in graphs over time (c,f,i,l) displaying the total number of cells in each domain and their status in the course of the video. Note the differences in the graphs between non-sensory and sensory domains, but not between control and MO-neurog1 embryos. (mn) Estimated local cell densities at 24 hpf are represented by color-coded cell centers across the whole otic epithelium (Video 10). Tg[Brn3c:GFP] embryos injected with H2B-mCherry and with/without MO-neurog1 at 1cell-stage were used for full lineage reconstruction (Tables 12). Anterior is always to the left. ID Datasets: 140507aX for control, 140519aX for MO-neurog1; see Figure 5—figure supplement 1 for additional analyses. (o) Graphic depicting the total number of cells in the otic vesicles for wild type (control, n = 3), neurog1hi1059/ hi1059 mutant in the Tg[Isl3:GFP] background (n = 3), and MO-neurog1 embryos (n = 2) at 24 hpf.
DOI: http://dx.doi.org/10.7554/eLife.22268.022

Figure 5.

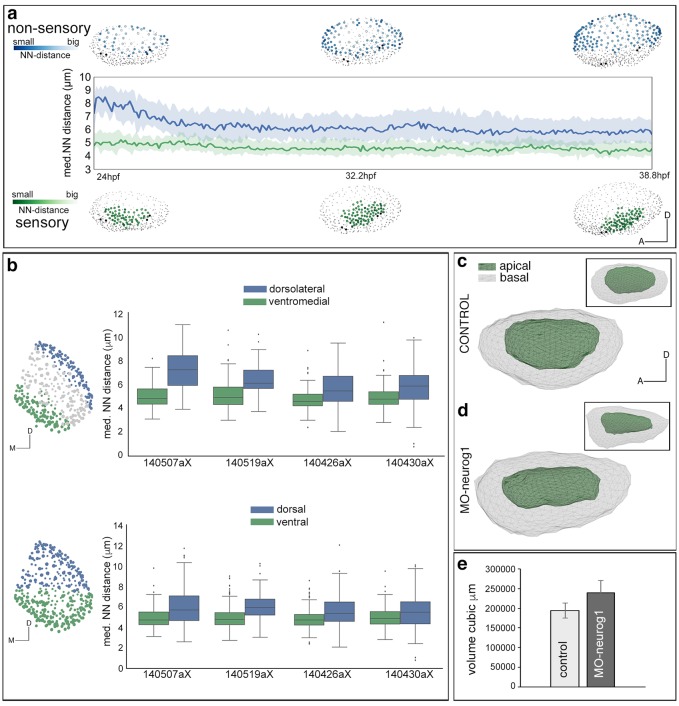
Figure 5—figure supplement 1. Tissue architecture in sensory and non-sensory domains.

Figure 5—figure supplement 1.

Tg[Brn3c:GFP] injected with H2B-mCherry mRNA at 1cell-stage were imaged and analyzed. (a) Plots at three time points showing the distribution of tracked neighboring otic cells within the non-sensory (blue) or sensory (green) domains in the context of the whole otic vesicle (grey dots). Color intensities represent the nearest neighbor distance (NN-distance, see legend); graph shows the median and quartiles of the NN-distance for each domain over time. Note that cells within the non-sensory territory are more spaced than cells in the sensory domain. ID Dataset: 140507aX. (b) Graph showing the differences in average NN-distances between the ventromedial and dorsolateral domains (top), or ventral and dorsal territories (bottom) of several ears. Note that cells within the dorsolateral/dorsal territories are more spaced than cells in the ventromedial/ventral domains. Cell selections in the context of the whole ear for 140426aX are shown in the left-hand side. ID Datasets: 140507aX, 140519aX, 140430aX, 140426aX. (ce) Comparison of the volumes of otic vesicles of control and MO-neurog1 embryos at 24 hpf. (cd) Lateral views of otic vesicle volumes depicting the epithelial surfaces: basal/outer (grey mesh) and apical/inner (green mesh); insets in (cd) display the corresponding dorsal views. ID Datasets: 140507aX for control, 140519aX for MO-neurog1. (e) Graph showing the average volume of otic vesicles for control (n = 3) and MO-neurog1 (n = 2) embryos in cubic µm. Note the increase of the average volume in MO-neurog1. Tg[Brn3c:GFP] embryos were injected with H2B-mCherry and with/without MO-neurog1 at 1cell-stage.