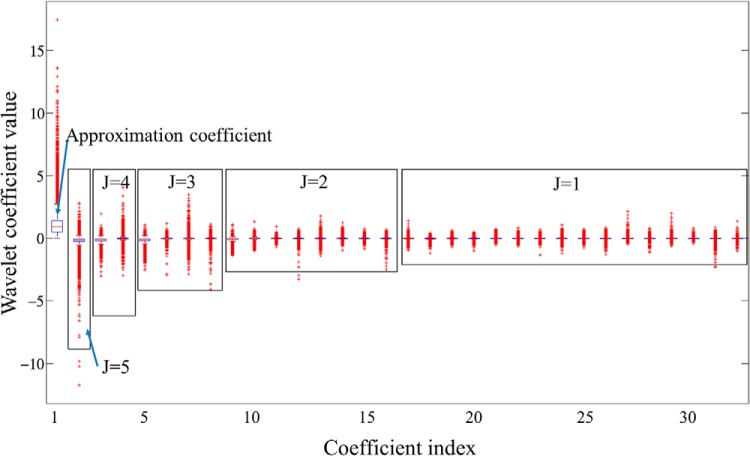
Figure 5.
Box plot of coefficient variations obtained from the training curves. The first coefficient is A5 (approximation coefficient), followed by detail coefficients at 5 scale levels from high to low as D5, D4, D3, D2, and D1. Within each scale level, the coefficients dji are arranged in a time-ascending order. The x-axis represents the global coefficient index.

