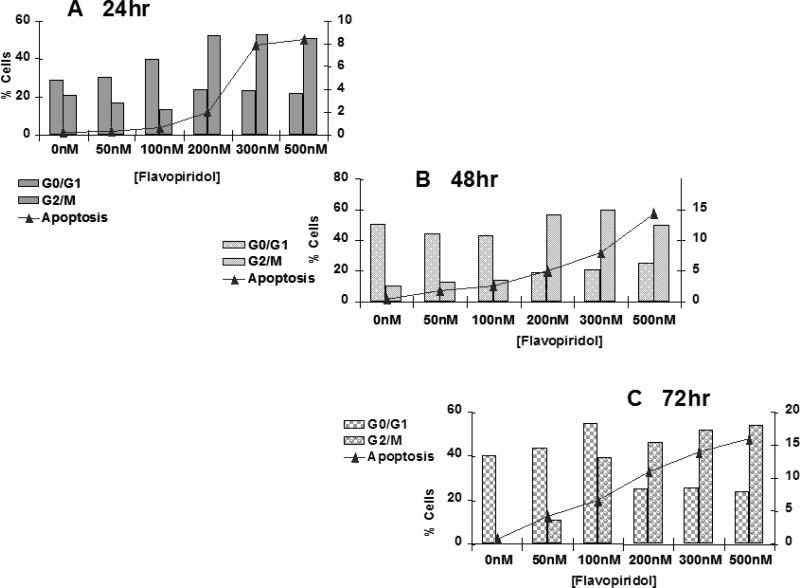
Figure 11.
Cell cycle analysis of flavopridol treated T98G cells.
Subconfluent cultures of T98G cells were treated with 50 – 500 nM of flavopridol for 24, 48 or 72 hrs (A, B, C respectively). The cells were harvested, fixed in ice cold ethanol and stained using PI (20 ug/ml). The percent of cells in the G0/G1, G2/M phases of the cell cycle and the percentage of cells undergoing apoptosis (Sub G0/G1) was determined by Each point is an average of two flow cytometric analysis. separate experiments (variation <5%).

