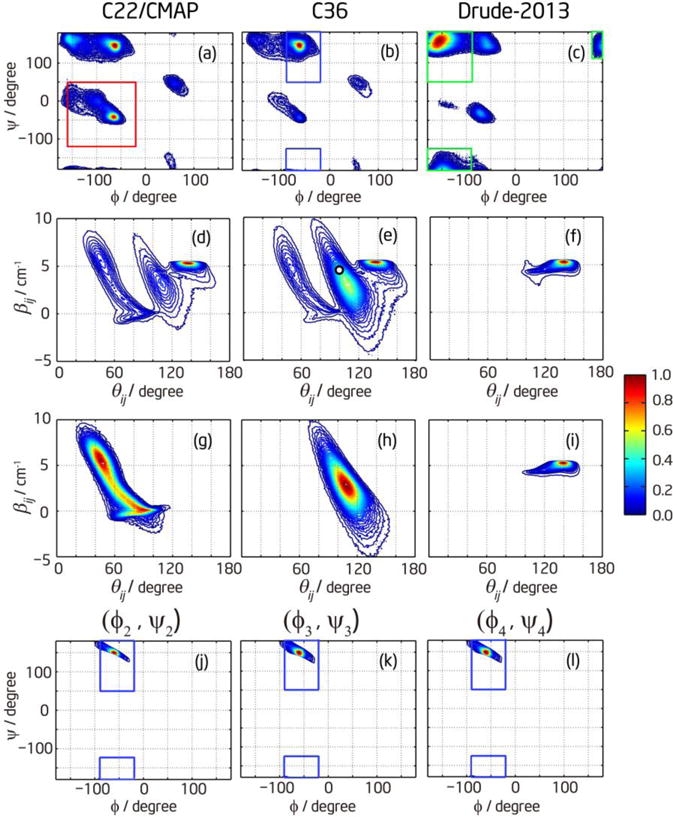
Figure 6.

The conformational distributions of (Ala)5 from the MD simulations. The first row shows the Ramachandran plots for different force fields including all conformers, and the corresponding βij-θij plots are in the second row. (a, d) are for C22/CMAP, (b, e) are for C36, and (c, f) are for Drude-2013. The third row is the βij–θij plot for each conformer. The red box in (a) shows the definition of α+, and the corresponding distribution in the βij–θij plot is shown in (g). The blue boxes in (b) and the corresponding distribution in (h) are for ppII. The green boxes in (c) and the corresponding distribution in (i) are for β structure. (a)–(i) include statistics from all three middle residues. The fourth row shows the region of Ramachandran plot in (b) allowed by the confidence interval from spectral fitting for each residue: (j) is for (ϕ2, ψ2), (k) is for (ϕ3, ψ3), and (l) is for (ϕ4, ψ4). The blue boxes show the definition of ppII.
