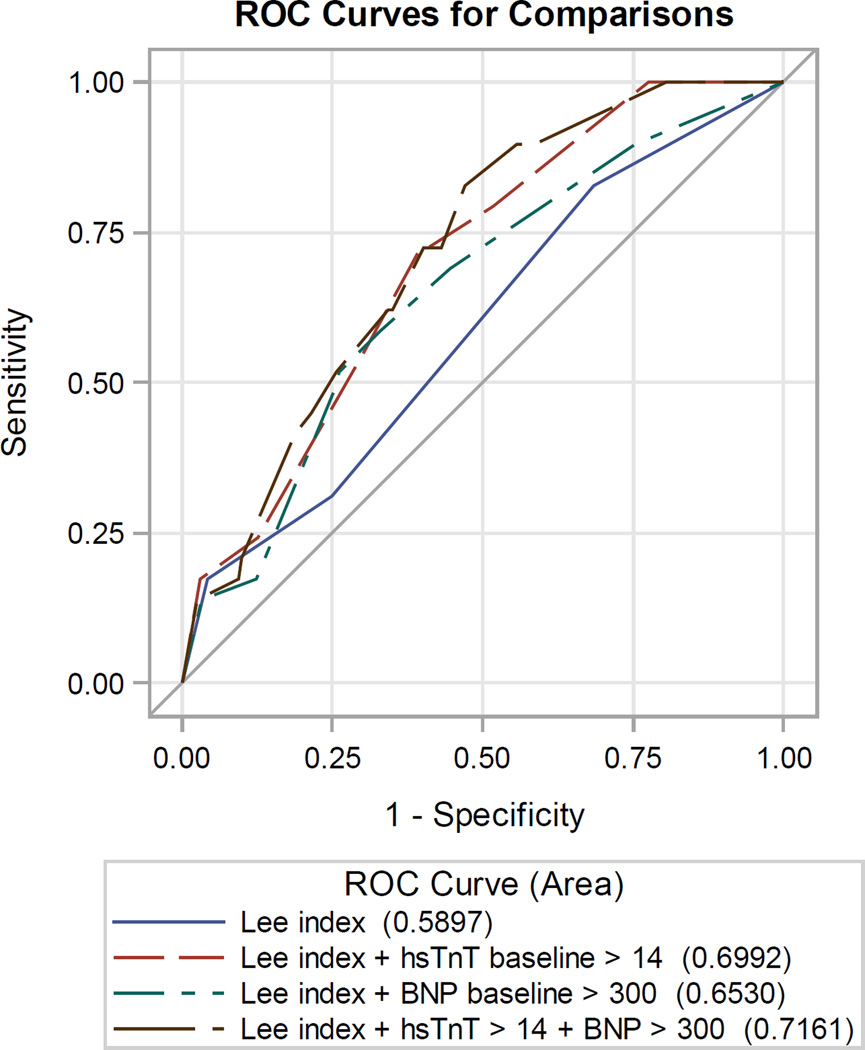
Figure 2.
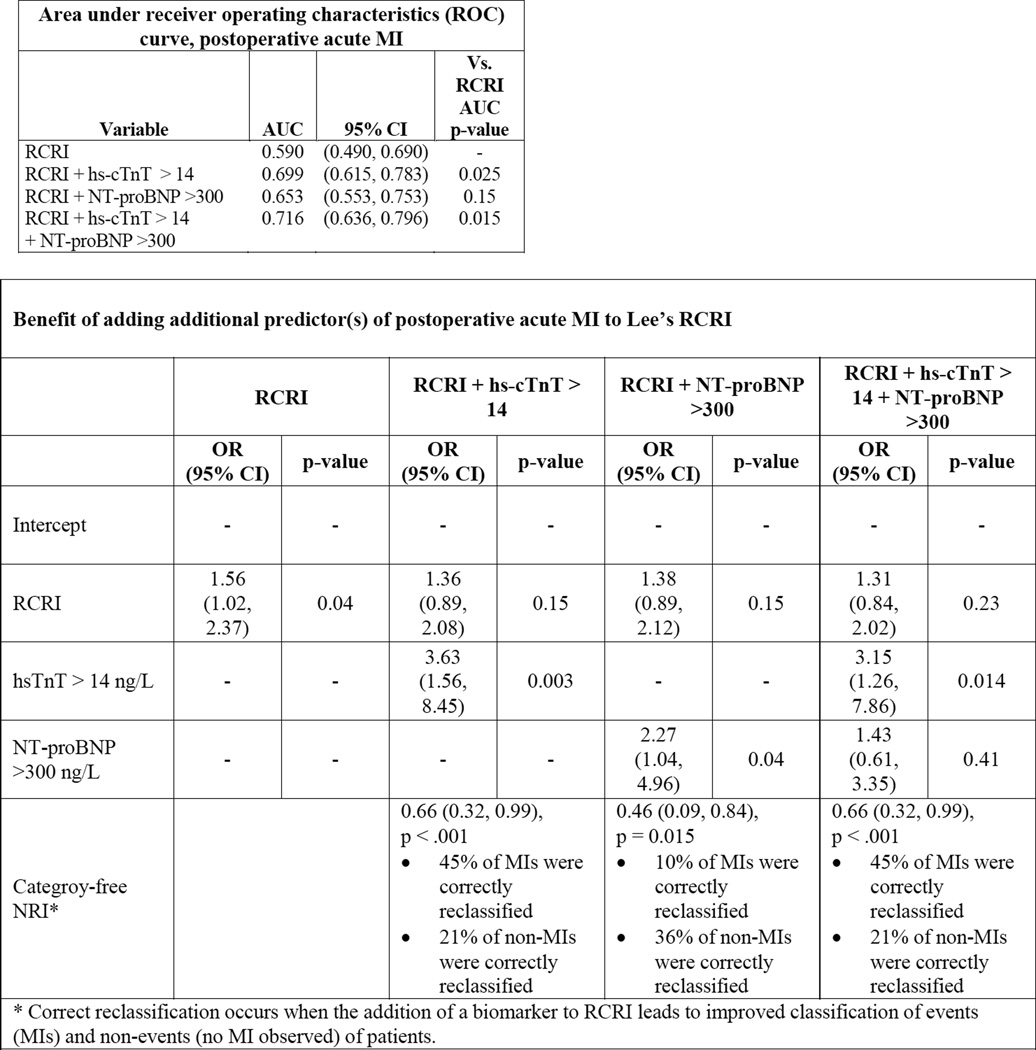
| Area under receiver operating characteristics (ROC) curve, postoperative acute MI | |||
|---|---|---|---|
| Variable | AUC | 95% CI | Vs. RCRI AUC p-value |
| RCRI | 0.590 | (0.490, 0.690) | - |
| RCRI + hs-cTnT > 14 | 0.699 | (0.615, 0.783) | 0.025 |
| RCRI + NT-proBNP >300 | 0.653 | (0.553, 0.753) | 0.15 |
| RCRI + hs-cTnT > 14 + NT-proBNP >300 |
0.716 | (0.636, 0.796) | 0.015 |
| Benefit of adding additional predictor(s) of postoperative acute MI to Lee’s RCRI | ||||||||
|---|---|---|---|---|---|---|---|---|
| RCRI | RCRI + hs-cTnT > 14 |
RCRI + NT-proBNP >300 |
RCRI + hs-cTnT > 14 + NT-proBNP >300 |
|||||
| OR (95% CI) |
p-value | OR (95% CI) |
p-value | OR (95% CI) |
p-value | OR (95% CI) |
p-value | |
| Intercept | - | - | - | - | - | - | - | - |
| RCRI | 1.56 (1.02, 2.37) |
0.04 | 1.36 (0.89, 2.08) |
0.15 | 1.38 (0.89, 2.12) |
0.15 | 1.31 (0.84, 2.02) |
0.23 |
| hsTnT > 14 ng/L | - | - | 3.63 (1.56, 8.45) |
0.003 | - | - | 3.15 (1.26, 7.86) |
0.014 |
| NT-proBNP >300 ng/L |
- | - | - | - | 2.27 (1.04, 4.96) |
0.04 | 1.43 (0.61, 3.35) |
0.41 |
| Categroy-free NRI* |
0.66 (0.32, 0.99), p <.001 • 45% of MIs were correctly reclassified • 21% of non-MIs were correctly reclassified |
0.46 (0.09, 0.84), p = 0.015 • 10% of MIs were correctly reclassified • 36% of non-MIs were correctly reclassified |
0.66 (0.32, 0.99), p <.001 • 45% of MIs were correctly reclassified • 21% of non-MIs were correctly reclassified |
|||||


