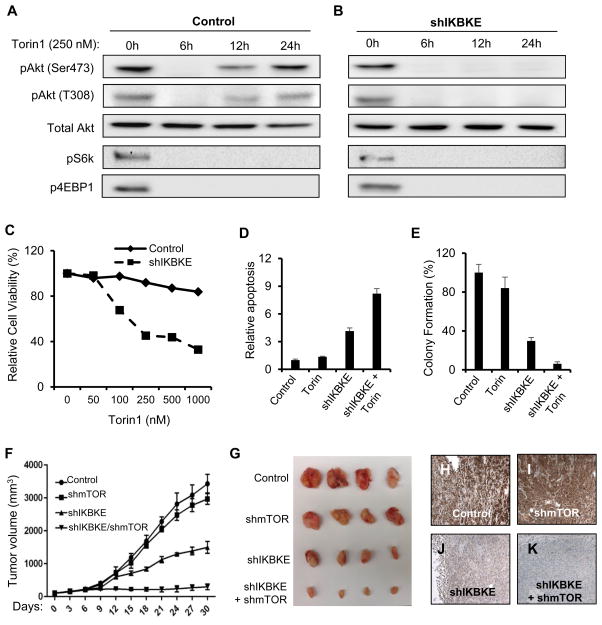
Figure 5. IKBKE mediates AKT reactivation post-mTOR inhibition.
(A–B) Western blot showing phosphorylation of Akt and other mTOR substrates, S6K and 4EBP1, in control Panc-1 cells (A) and Panc-1 cells with IKBKE knockdown (B) in response to treatment with Torin-1 up to 24 hours. (C) Relative cell viability of Panc-1 cells measured by MTT assay 5 days after treatment with increasing dosage of the mTOR inhibitor Torin-1 in the presence and absence of IKBKE knockdown. (D) Cleaved-Caspase 3 staining in Panc-1 cells indicates that while mTOR inhibition alone using Torin-1 does not lead to a significant increase in apoptosis, combined inhibition of IKBKE and mTOR leads to a significant increase in apoptosis. (E) Soft agar colony formation assay in Panc-1 cells indicates that while mTOR inhibition alone does not affect tumorigenicity of the cells, combined inhibition of mTOR and IKBKE leads to significant decrease in tumorigenicity. (F) Tumor volume measurement indicates significant decrease in growth of MiaPaca-2 cell line derived xenograft tumors (n = 6) in response to inducible IKBKE knockdown, and synergistic effect with combined IKBKE and mTOR knockdown while mTOR knockdown has no effect. (G) Representative images of xenograft tumors 4 weeks after induction of shRNA indicate significant reduction in tumor volume in response to IKBKE knockdown and synergistic reduction with combined IKBKE/mTOR knockdown. (H–K) Representative IHC images showing phosphorylation of AKT at Serine-473 in xenograft tumors derived from Control (H), shmTOR (I), shIKBKE (J), and shIKBKE/shmTOR (K) MiaPaca-2 cell lines. Error bars represent Standard Deviation. Statistical significance was determined using a Student’s two-tailed t-test. * P<0.05; ** P<0.01

