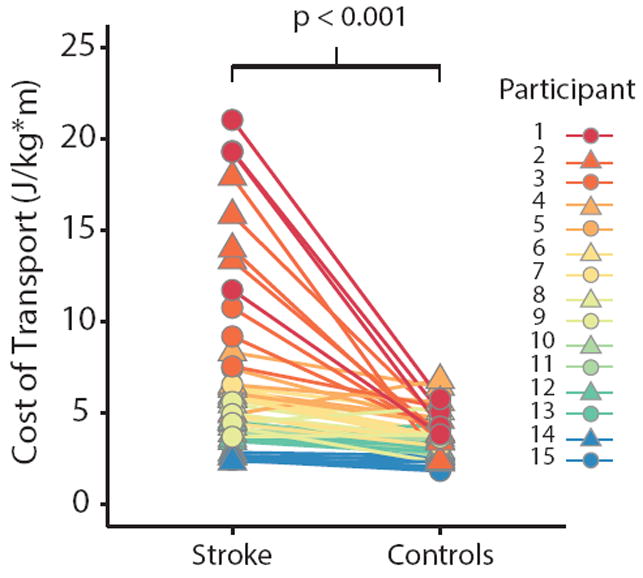
Figure 1.

Metabolic cost of transport for stroke survivors and age-matched controls for all walking speeds. Each data point represents a single bout of walking, and each line connects matched walking speeds between a stroke survivor and their control. There are four pair of data points for each stroke survivor and control, with the exception of those individuals who only completed three bouts of walking. Each color represents a different stroke survivor and control pair.
