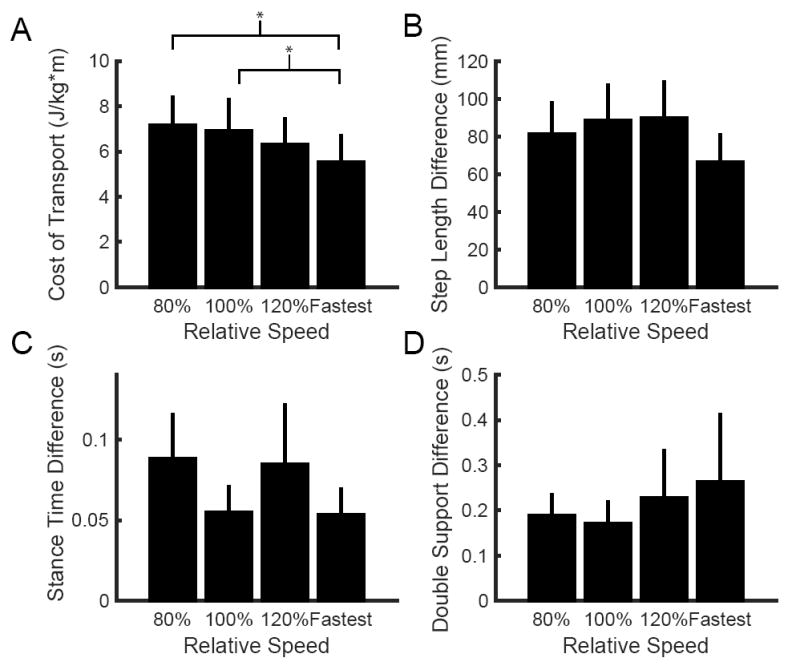
Figure 2.

Speed-dependent differences in (A) metabolic cost of transport, (B) absolute step length difference, (C) absolute stance time difference, and (D) absolute double support time difference across walking speeds for our sample of stroke survivors. For the first three conditions, walking speed is expressed relative to each individual’s self-selected speed. Across the group, the fastest comfortable speed represented a variable percentage of each individual’s self-selected speed and is simply noted ‘Fastest’. This figure only includes cases when an individual’s fastest speed was greater than 120% of the self-selected. Four individuals were unable to walk faster than 120% of their self-selected speed, and therefore did not have data points for the fastest comfortable speed. Asterisks represent statistically significant differences at the p < 0.05 level.
