
Figure 5.
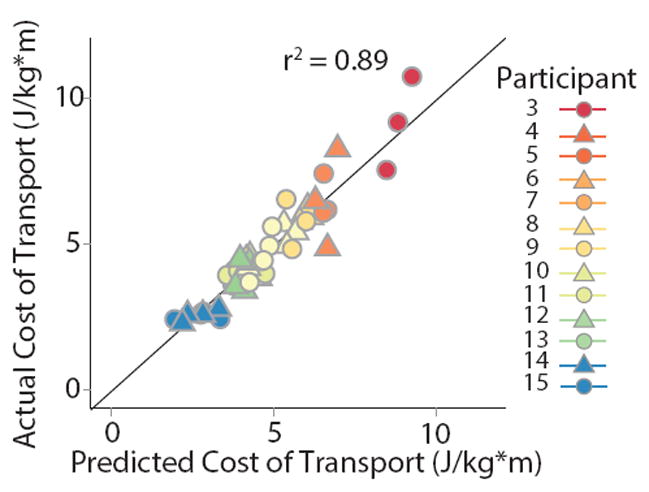
Fit of the full regression model including speed and the step position contribution to step length difference. The model explained nearly 90% of the variance in the cost of transport within and across individuals. Data points which lie on the diagonal black line indicate that the model predicted the exact cost of transport for that individual. Points above and below the line indicate under- and over-estimates respectively.