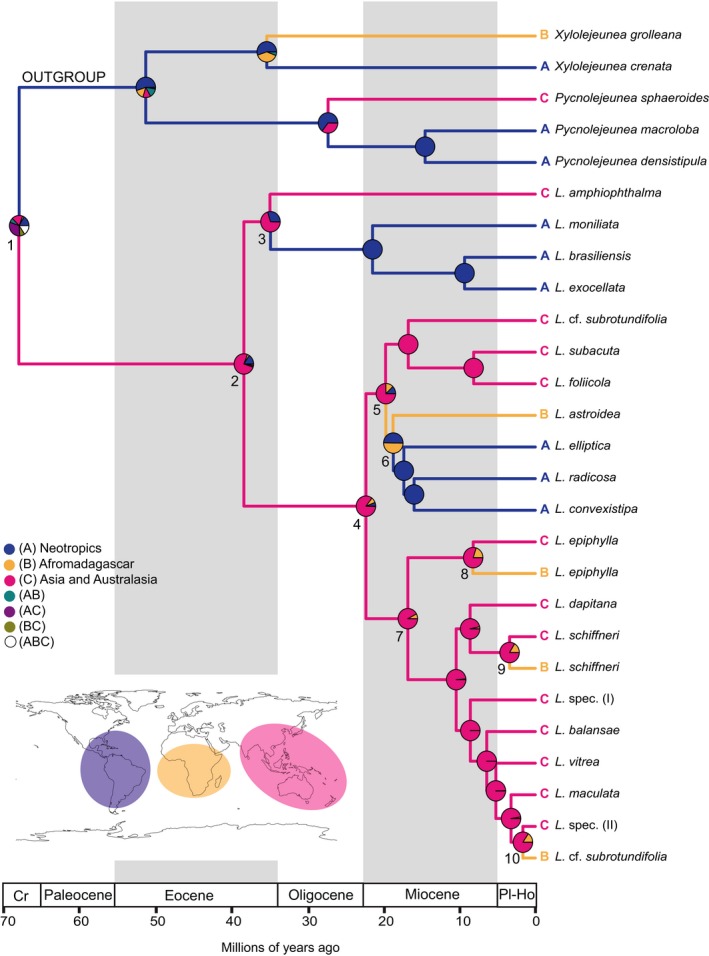
Figure 4.

Result of the biogeo BEARS analysis of Leptolejeunea in combination with the modified BEAST chronogram. Circles at nodes represent probabilities for ancestral areas resulting from DIVALIKE analysis accounting for founder‐event speciation. See Table 4 for percent values. Branches are colored according to the most probable area for splits as indicated by biogeo BEARS
