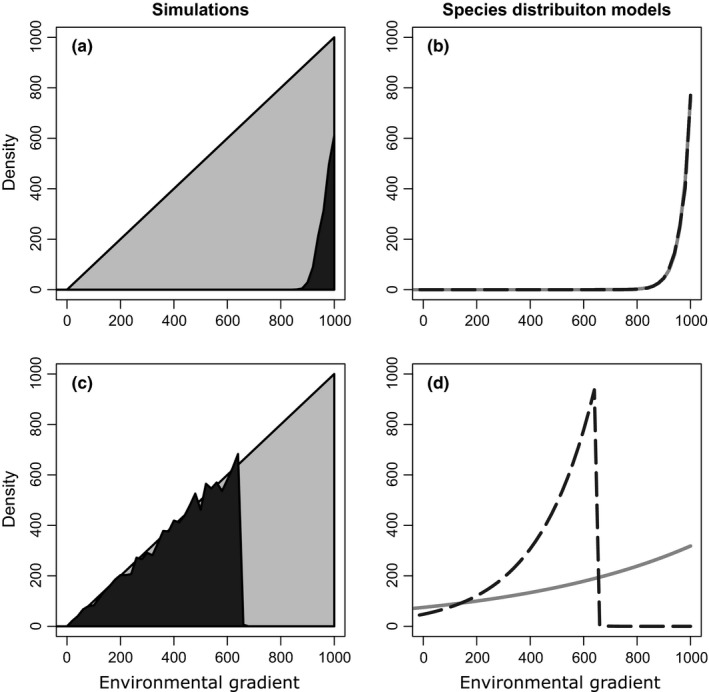
Figure 3.

Species' distributions models (SDMs) had a mixed record of identifying the effect of competition on species' distributions in our simulations. Panels (a) and (c) plot the density of the focal species (gray shaded region) across the environmental gradient. In the absence of competition, the density of the focal species is linearly related to the environmental gradient. However, competition restricts the focal species to a subset of the gradient (black shaded region). Panels (b) and (d) show the density of the focal species predicted by two SDMs, one considering solely the abiotic environment (gray line) and the other considering both the abiotic environment and competition (black dotted line). In panel (b), the two SDMs made predictions that are almost indistinguishable and it is difficult to identify the effect of competition. In contrast, panel (d) shows that an SDM including species interactions (black dotted line) accurately describes the abundance of the focal species, while an SDM including only the abiotic environment does not (gray solid line)
