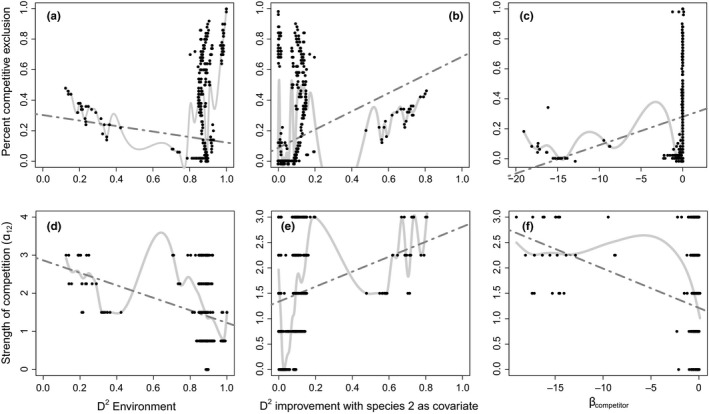
Figure 4.

Scatterplots of the effect of competition on the distribution of the focal species for each of the statistics derived from species' distributions models (SDMs) (columns) and each measure of the importance of competition (rows). Each black point represents a single simulation; the dark gray dashed line represents the relationship inferred by a linear model and the light gray solid line represents the relationship inferred by a generalized additive model. a) percent competitive exclusion versus D2 Environment, b) percent competitive exclusion versus D2 improvement with species 2 as a covariate c) percent competitive exclusion versus βcompetitor. D) strength of competition (α12) versus D2 environment e) Strength of competition versus D2 improvement with species 2 as covariate f) Strength of competition versus βcompetitor
