
Fig. 1.
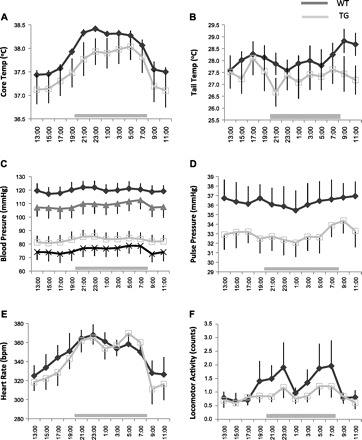
Measurements for 24 h of core body temperature (A), tail temperature (B), systolic and diastolic blood pressure (C), pulse pressure (D), heart rate (E), and locomotor activity (F). Each graph represents data collected from 8 rats in each group: wild type (WT; black) and transgenic (TG; gray). In C, systolic and diastolic blood pressure, respectively, are represented by closed diamonds and open rectangles (WT) or triangles and × (TG). Data were collected every 10 s and averaged for every 2 h within, then between rats, and are presented as means ± SE. Horizontal gray bar represents the time of darkness. Lights were on from 8 AM until 8 PM. bpm, beats/min.