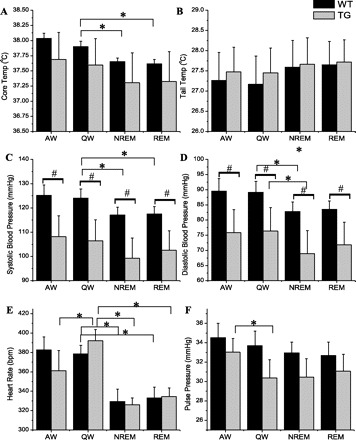
Fig. 2.

Core body temperature (A), tail temperature (B), systolic (C) and diastolic (D) blood pressure, heart rate (E), and pulse pressure (F), in each wake/sleep state, in WT (black) and TG (gray) rats. Each bar represents an average of 6–8 rats in specific wake/sleep stage: active wake (AW), quiet wake (QW), non-rapid eye movement sleep (NREM), and rapid eye movement sleep (REM). Data were collected over 48 h, averaged within, then between rats, and are presented as means ± SE. *P < 0.05 vs. QW, #P < 0.05 vs. WT in the same sleep/wake state.
