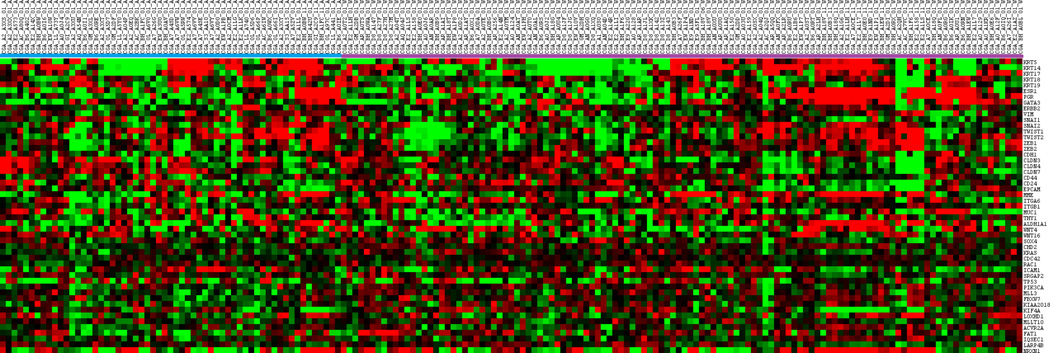
Figure 4.
Heat map representation of selected genes in TNBC only patients. Each row represents a gene and each column represents a patient. African American (A) patients located on the right hand side, while Caucasian (C) patients located on the left. Red indicates upregulation, green indicated downregulation, black indicates no change.

