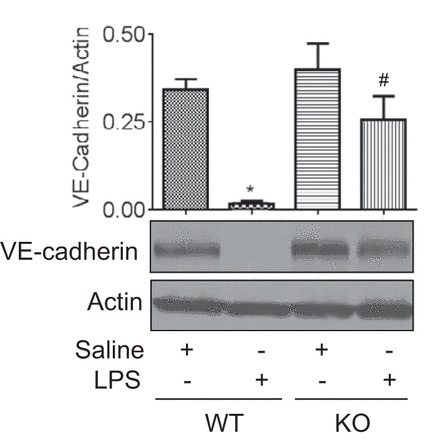
Fig. 3.

Effect of PLC-ε deficiency on LPS-induced decrease in VE-cadherin levels. Lung homogenates from WT and KO mice exposed to LPS as in Fig. 1 were analyzed for VE-cadherin levels by immunoblotting. Actin levels were used to monitor loading. The bar graph represents the effect of PLC-ε deficiency on LPS-induced decrease in VE-cadherin levels normalized to actin levels. Data are means ± SE (n = 3 for each condition). *P <0.05 vs. saline WT; #P vs. LPS WT.
