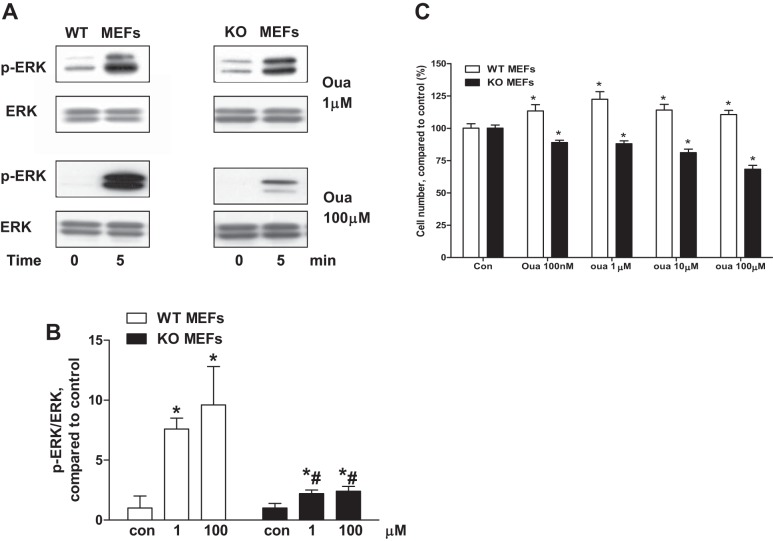
Fig. 5.
Ouabain-induced signaling in WT mouse embryonic fibroblasts (MEFs) and cav-1 KO MEFs. A: representative Western blots from 4 independent experiments. B: quantitation data on ERK activation. C: cells were treated by different concentrations of ouabain for 96 h. Cell proliferation was measured by CyQUANT assay (n = 8). One-way ANOVA and post hoc analysis were used to compare the ouabain concentration effects. *P < 0.05 vs. Con. Student's t-test was used to compare ouabain effects between WT and cav-1 KO MEFs, #P < 0.05 vs. WT MEFs at the same ouabain concentration.

