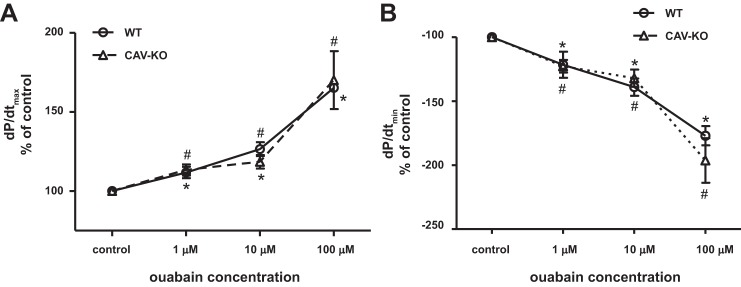
Fig. 9.
Ouabain-induced contractility in perfused working hearts from WT and cav-1 KO mouse hearts. Measurements of steady-state cardiac function were made at 10 mmHg preload and 60 mmHg afterload. x-Axis is the log10 scale. A: dP/dt max; B: dP/dt min. Each data point represents mean ± SE. n = 6. Two-way ANOVA was used to analyze the effects of ouabain doses, mouse strains, and the interaction of both. There is no statistically different in contractility between the strains (WT and KO). One-way ANOVA and Bonferroni's post hoc test were used to compare ouabain dose effects. #P < 0.05 vs control in WT, *P < 0.05 vs. control in cav-KO.

