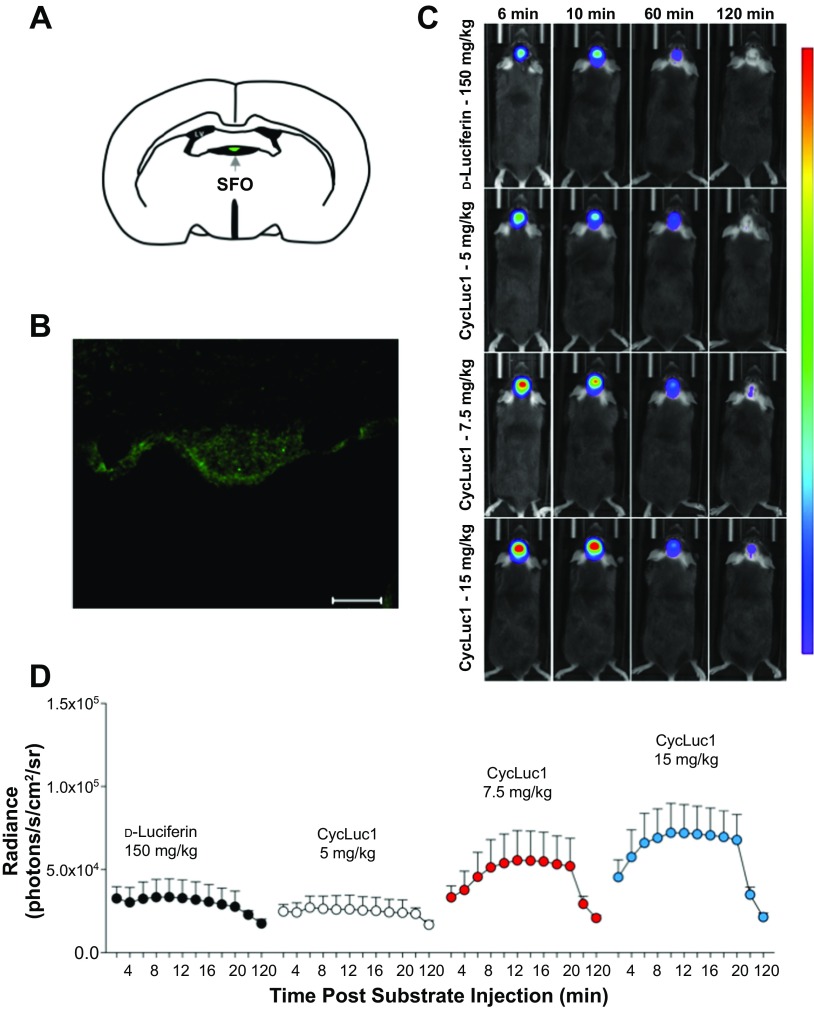
Fig. 2.
CycLuc1 enhances in vivo bioluminescence imaging of gene expression in the SFO. A: schematic of the SFO. LV, lateral ventricle. B: representative immunohistochemistry demonstrating robust firefly luciferase expression in the SFO following targeted AdCMV-luc administration. Scale bar = 50 μm. C: original bioluminescent images of photon emission from the SFO at 6, 10, 60, and 120 min after substrate injection of d-luciferin (150 mg/kg) or CycLuc1 (5, 7.5, and 15 mg/kg). All images are from the same animal and plotted on the same scale. The areas of high photon emission are displayed in red, and the areas of low photon emission are displayed in blue. D: temporal measurements of SFO bioluminescent emission from 2 to 120 min following substrate administration; n = 8.

