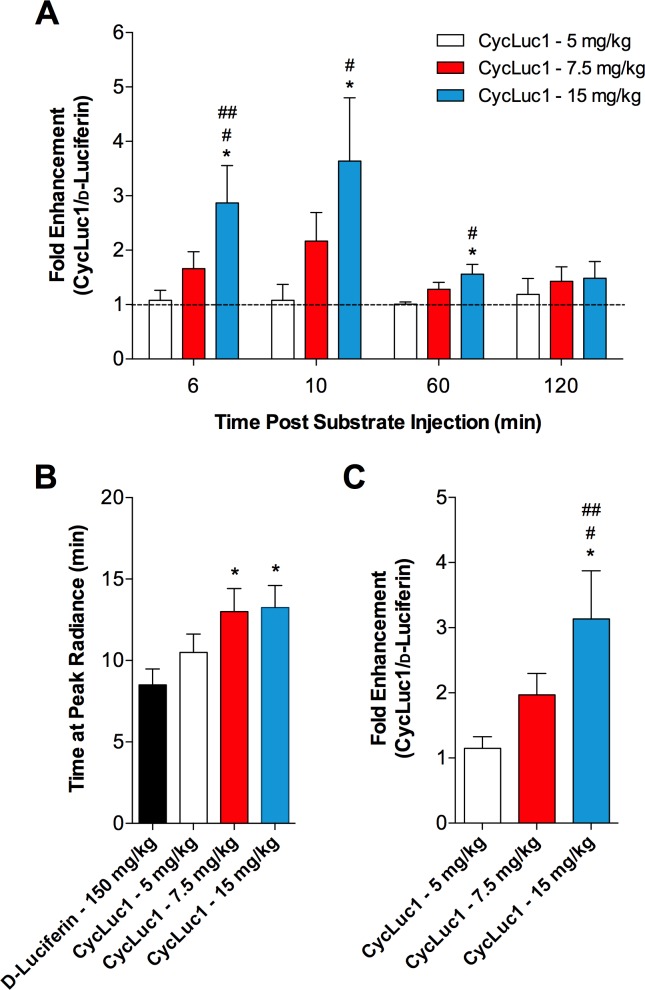
Fig. 3.
Relative enhancement of CycLuc1 for in vivo bioluminescence imaging of gene expression in the SFO. A: fold enhancement of CycLuc1 (CycLuc1/d-luciferin) bioluminescent emission from the SFO at 6, 10, 60, and 120 min after substrate injection. Values are normalized to the d-luciferin condition, which is represented at a value of 1 by the dashed line. B: the time at which the peak radiance occurred after substrate injection. C: fold enhancement of CycLuc1 at the peak radiance. n = 8. *P < 0.05 vs. d-luciferin; #P < 0.05 vs. CycLuc1 5 mg/kg; ##P < 0.05 vs. CycLuc1 7.5 mg/kg.

