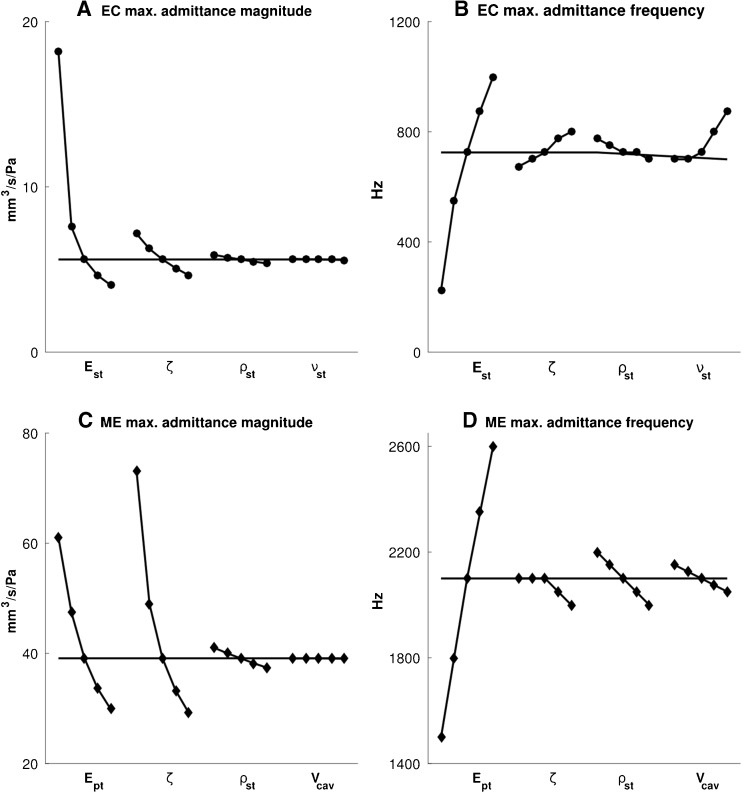
FIG. 11.
One-parameter-at-a-time sensitivity analysis, showing the influence of the material parameters on the maximum admittance magnitudes (A, C) and the corresponding frequencies (B, D) for the ear-canal model (A, B) and the middle-ear model (C, D). The horizontal solid line indicates the corresponding values for the baseline model. E st = Young’s modulus and ν st = Poisson’s ratio of the soft tissue in the ear-canal model; E pt = Young’s modulus of the pars tensa and V cav = volume of the air cavity in the middle-ear model; ζ = damping ratio and ρ st = density of soft tissue in both models.

