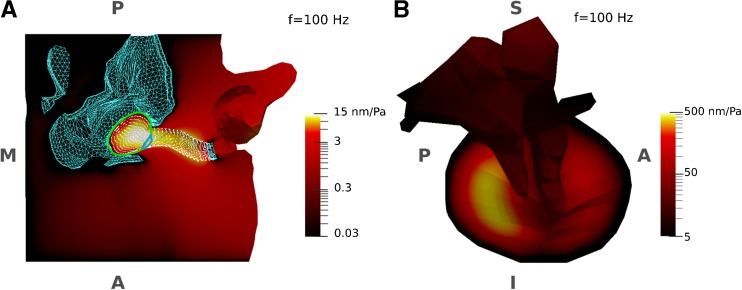
FIG. 3.
Displacement-magnitude maps of the models in response to sound pressures at a low frequency (100 Hz), normalized with respect to the amplitude of the applied sound pressure (0.2 Pa). Due to the small displacements of some components of the models (e.g. ossicles), the displacement maps are presented using logarithmic scales. The logarithmic colour scales represent displacements from zero (black) to a maximum (white) with monotonically increasing brightness. A Ear-canal model with TM fixed, sectioned in a horizontal plane to provide a superior-to-inferior view of the temporal bone and the internal surface of the ear canal. The TM has been removed to provide a more complete view of the canal and only the borders of the PT (green curve) and PF (blue curve) are presented. The surface of the canal wall is presented by its mesh nodes (white dots). The fixed surfaces of the temporal bone and the probe tip are shown with a blue mesh. The largest displacements are in the medial region of the canal. B Medial-to-lateral view of the middle-ear model with canal wall fixed. The largest displacements are in the posterior portion of the TM. The anatomical orientation and abbreviations are the same as for Figure 1.

