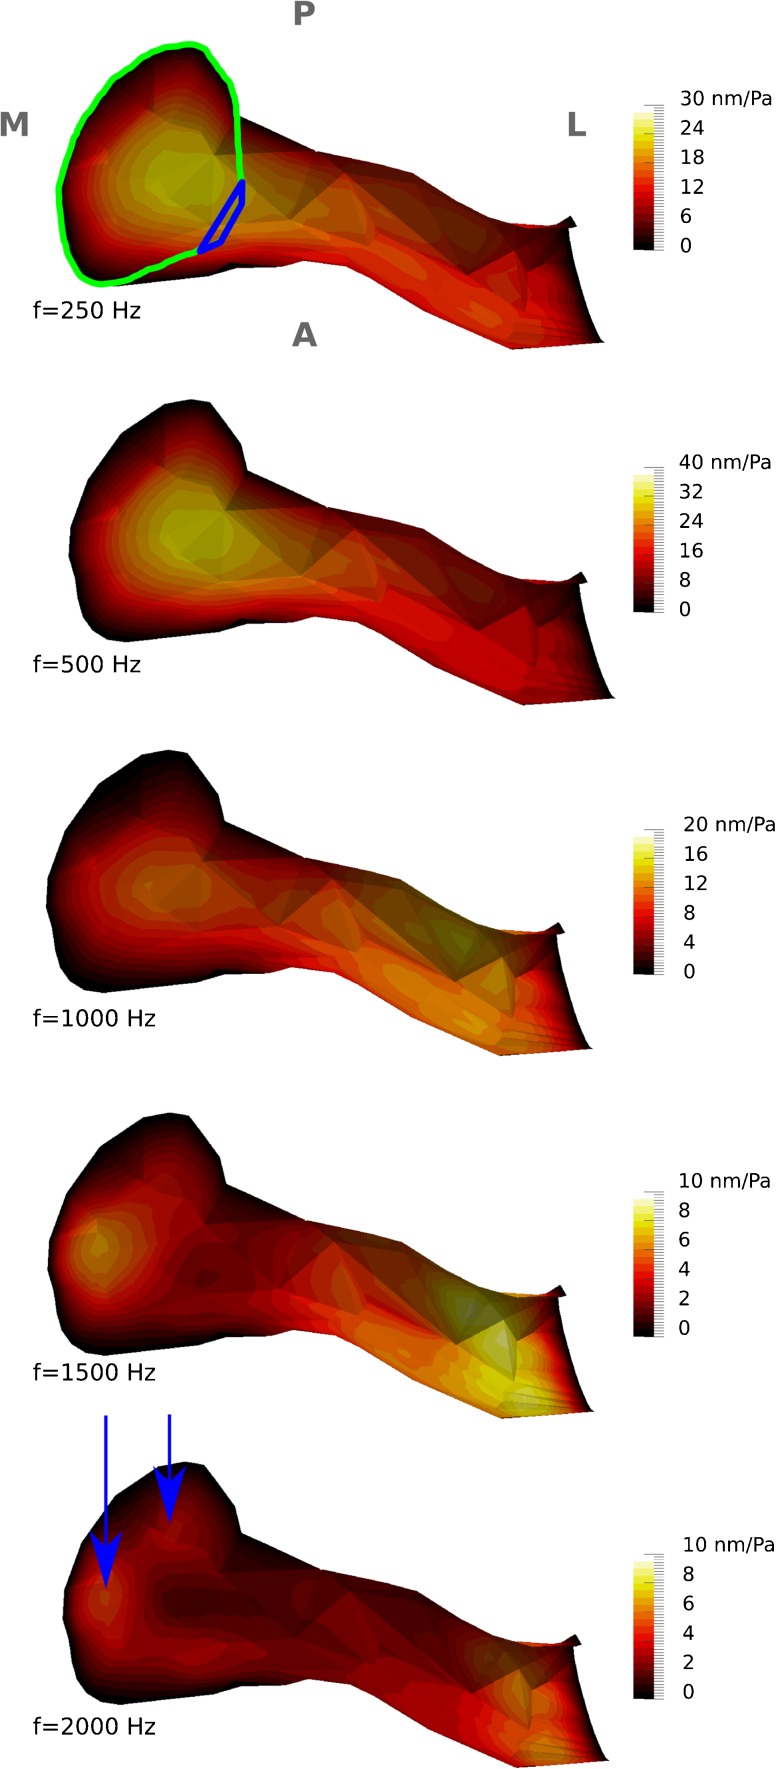
FIG. 4.
Displacement-magnitude maps of vibration patterns, normalized with respect to the amplitude of the applied sound pressure (0.2 Pa), for the inferior wall of the ear-canal model at five different frequencies. The colour scales are linear, and their maximum values are different for different frequencies. As in Figure 3A, the TM has been removed. The borders of the PT (green curve) and PF (blue curve) are presented and the anatomical orientation, and abbreviations are the same as for Figure 1A. The arrows indicate the regions of maximal displacement in the medial portion.

