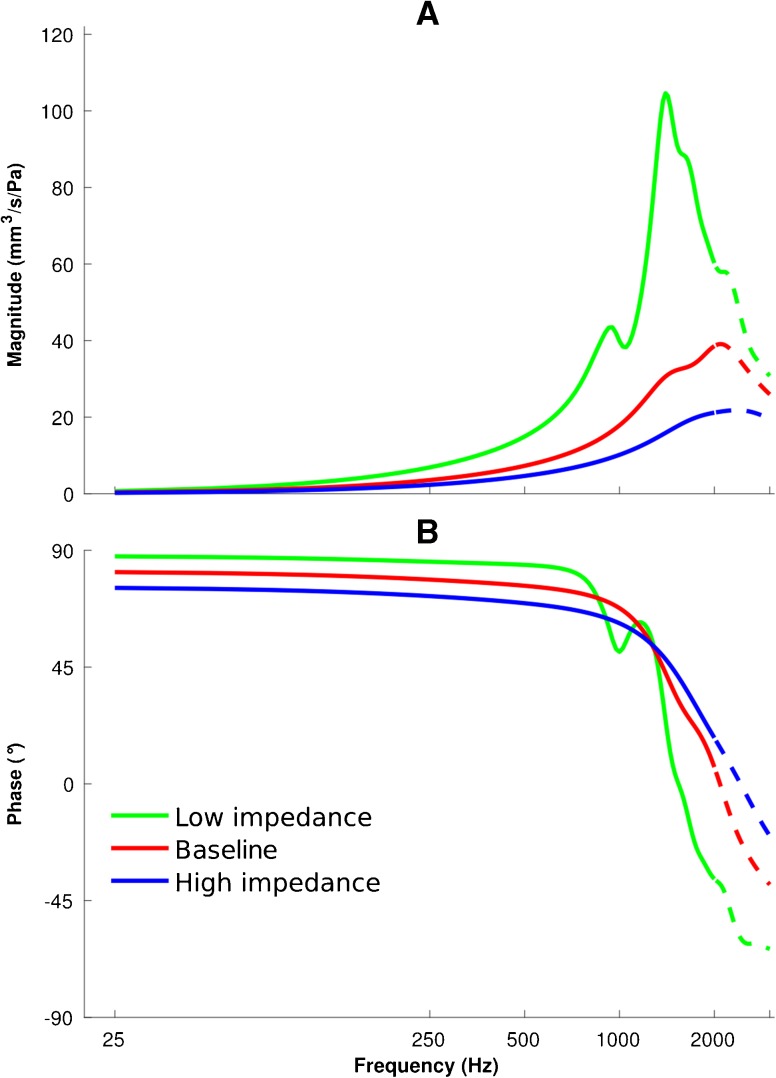
FIG. 7.
Admittance responses of the middle-ear models with a 25-Hz frequency resolution. Admittance magnitudes (A) and phases (B) are presented for low-impedance (green), baseline (red) and high-impedance (blue) parameters. The dashed curves are the extensions of the solid curves for frequencies above 2000 Hz.

