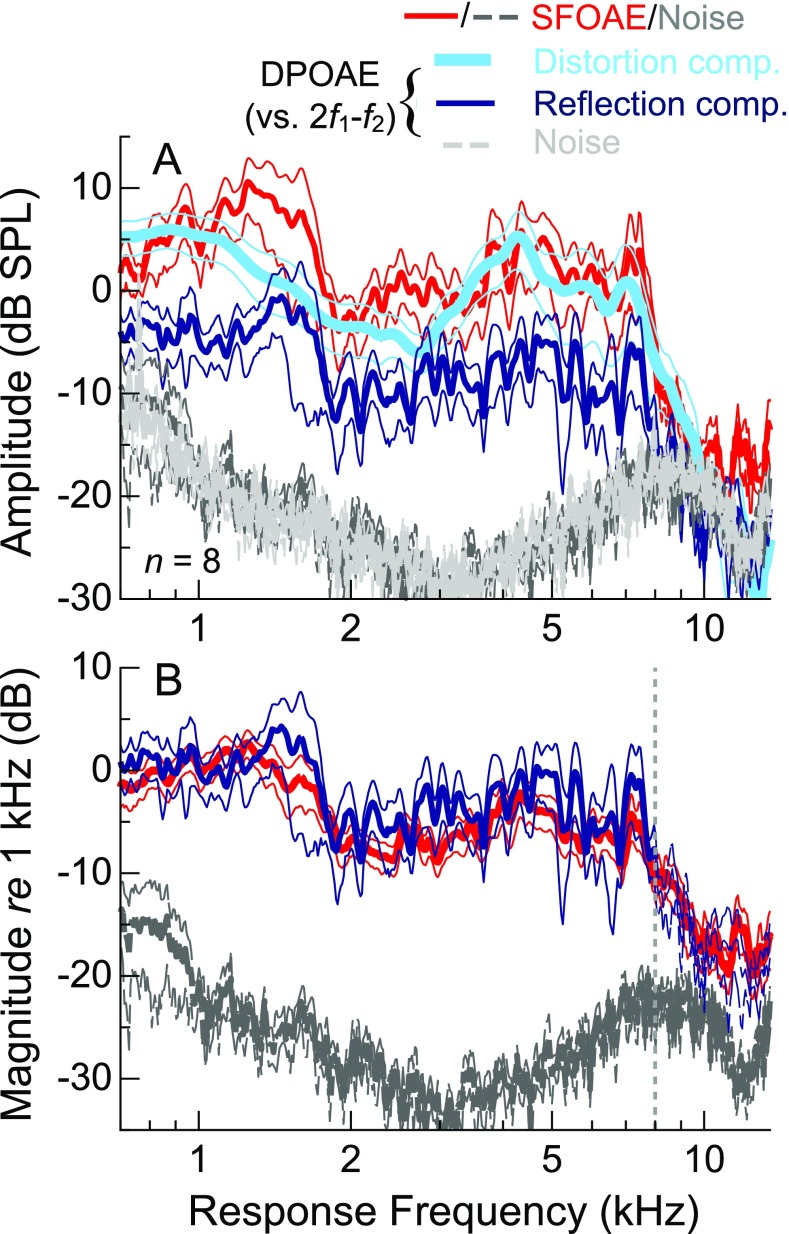
FIG. 10.
A Average (±1 SE) amplitudes of SFOAE responses and separated DPOAE components from the data previously compared in Figure 7. DPOAE component amplitudes are plotted vs. 2f 1-f 2, facilitating comparison of the reflection component and SFOAE, which are thought to arise via the same mechanisms. B Average (±1 SE) SFOAE and DPOAE reflection component magnitudes normalized to their respective levels at 1 kHz. The spectral shapes of the average responses are highly similar, consistent with the observations in the individual data shown in Figure 9. The average SFOAE noise floor is shown normalized to the average SFOAE response at 1 kHz. The dashed vertical line indicates where the average reflection component fell below the DPOAE noise floor, which is not shown for clarity.

