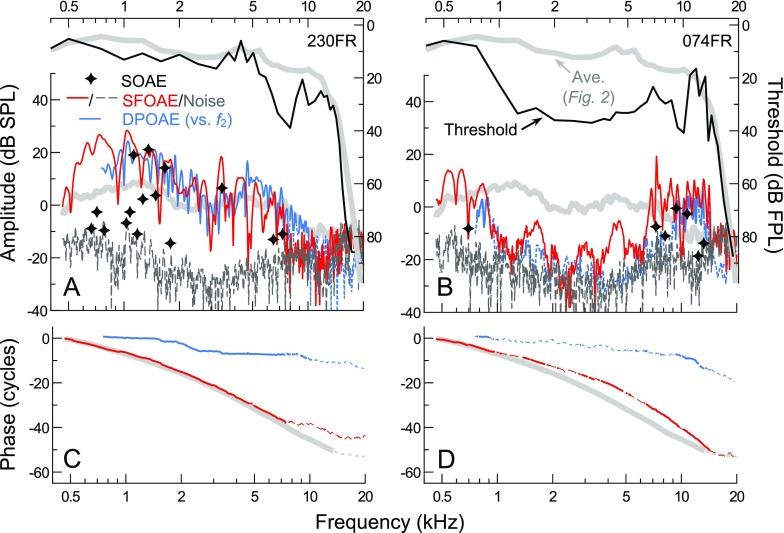
FIG. 11.
A, B Thresholds, SFOAEs, and DPOAE responses for two subjects with abnormal audiometric configurations. Average threshold and SFOAE amplitude curves from Figure 2 are shown for reference (thick gray lines). SFOAE and DPOAE phases are shown in C, D. DPOAEs are plotted vs. f 2, due to the dominance of the responses by the distortion component (separated components are not shown). Subject 230FR (A, C) had the largest low-mid frequency SFOAEs observed in this study despite a mild high-frequency threshold notch. Subject 074FR (B, D) had an extensive, mild mid-to-high frequency loss but abnormally large SFOAE amplitudes at high frequencies, even at those where thresholds exceeded the average by 15–20 dB. Multiple SOAEs (stars) were also observed between 7.3 and 13.1 kHz. In contrast, strong DPOAEs were only measurable near frequencies where thresholds approached the average curve. Dashed portions of the phase curves and DPOAE amplitude curves indicate SNR <9 dB (DPOAE noise floors not shown for clarity).

