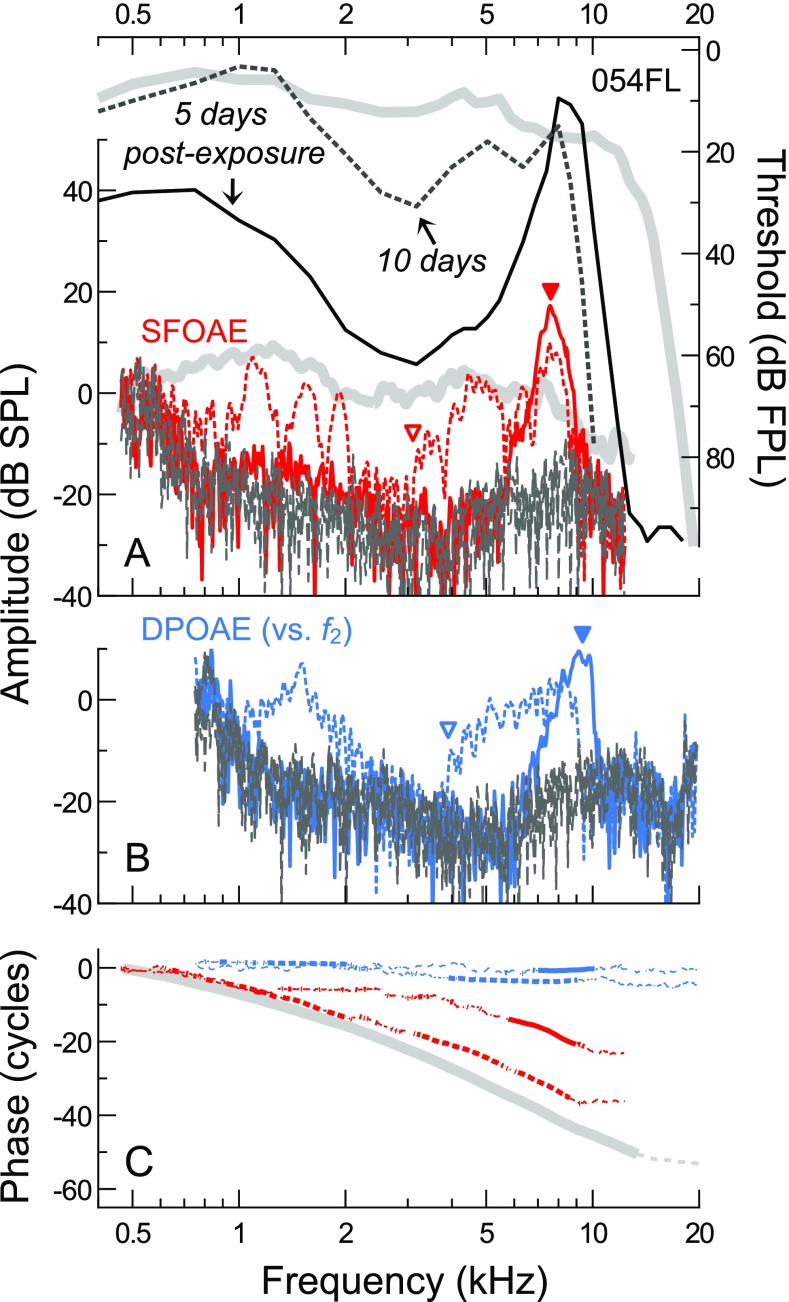
FIG. 12.
A, B Thresholds, SFOAEs, and DPOAE responses for subject 054FL obtained 5 and 10 days after noise exposure (solid and dashed lines, respectively). C SFOAE and DPOAE phases, with thin dashed portions of the curves indicating SNR <9 dB. DPOAE responses are plotted vs. f 2, as in Figure 11. Average thresholds and SFOAE amplitudes/phases from the normal-hearing subjects are shown with thick gray lines in A and C. Though a normal standard clinical audiogram was obtained pre-exposure, pre-exposure tracking thresholds were not available. To highlight the subtle frequency offset between the SFOAE and DPOAE responses, solid triangles indicate the positions of the high-frequency SFOAE/DPOAE amplitude peaks at 5 days post-exposure, and open triangles indicate where the responses became measurable above the noise floor for frequencies >3 kHz at 10 days post-exposure.

