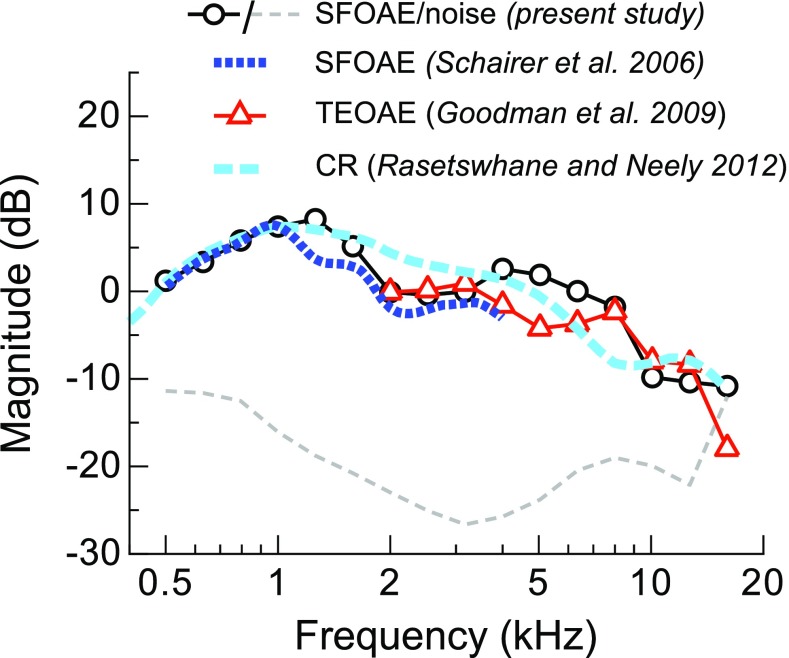
FIG. 13.
Similarity of the spectral shapes of SFOAEs, TEOAEs, and CR. Shown are the SFOAE amplitudes and noise floors from the present study averaged in 1/3rd-octave bins from 0.5 to 16 kHz (circles and dashed line, respectively), along with the mean amplitudes of SFOAEs evoked by 40 dB SPL tones from 0.5 to 4 kHz (from Fig. 11 of Schairer et al. 2006), median 1/3rd-octave averaged amplitudes for TEOAEs evoked by 73 dB peak-equivalent SPL clicks from 2 to 16 kHz (from Fig. 4 of Goodman et al. 2009), and the mean CR amplitude for a 40-dB SPL stimulus (from Fig. 7 of Rasetshwane and Neely 2012). SFOAE amplitudes are shown in dB SPL, with CR and TEOAE magnitudes shifted to match the average SFOAE amplitude from this study at 1 and 2 kHz, respectively.

