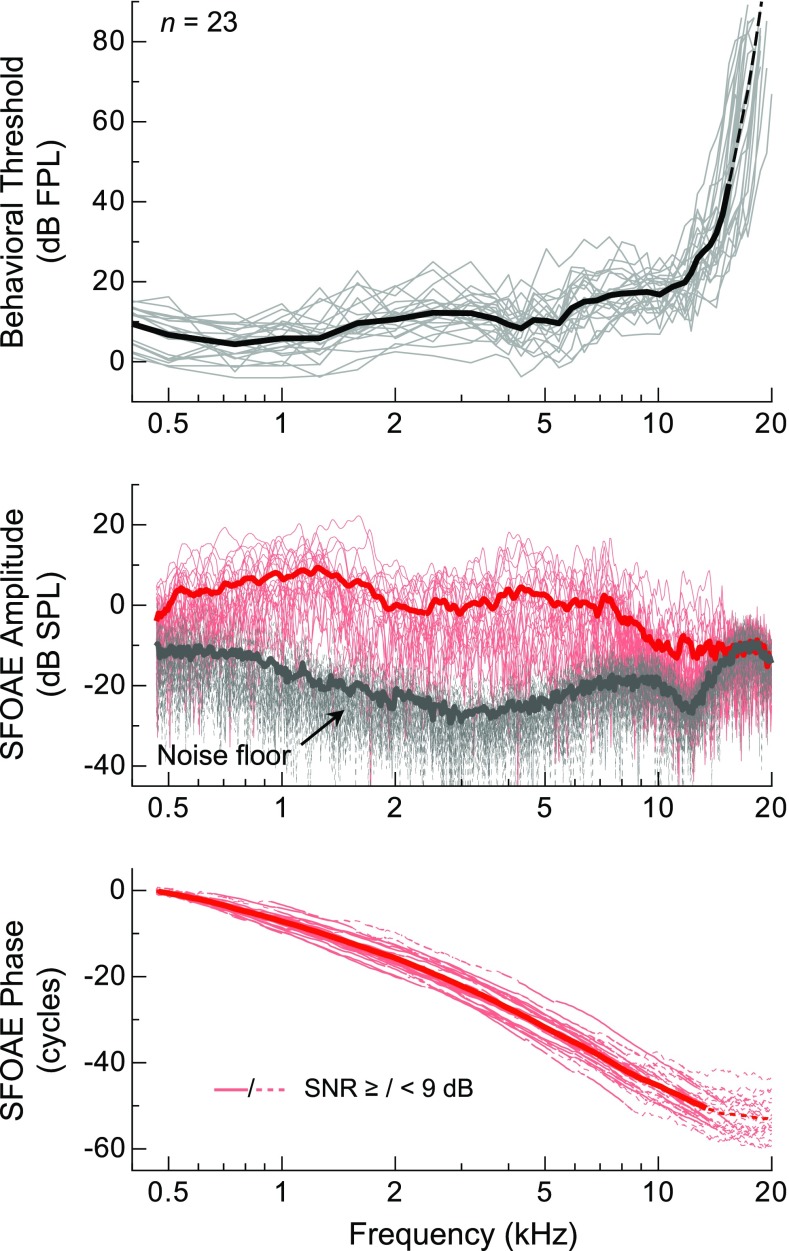
FIG. 2.
Individual (thin) and average (thick lines) behavioral thresholds and SFOAE amplitudes, noise floors, and phases for a probe level of 36 dB FPL. Average threshold calculations above 15.4 kHz (thin dashed line) required linear extrapolation of some of the individual curves due to non-responses above this frequency. Dashed gray portions of the individual SFOAE phase curves indicate frequencies where the SNR was less than 9 dB. The dashed portion of the average phase curve indicates where fewer than half of the data points satisfied this criterion.

