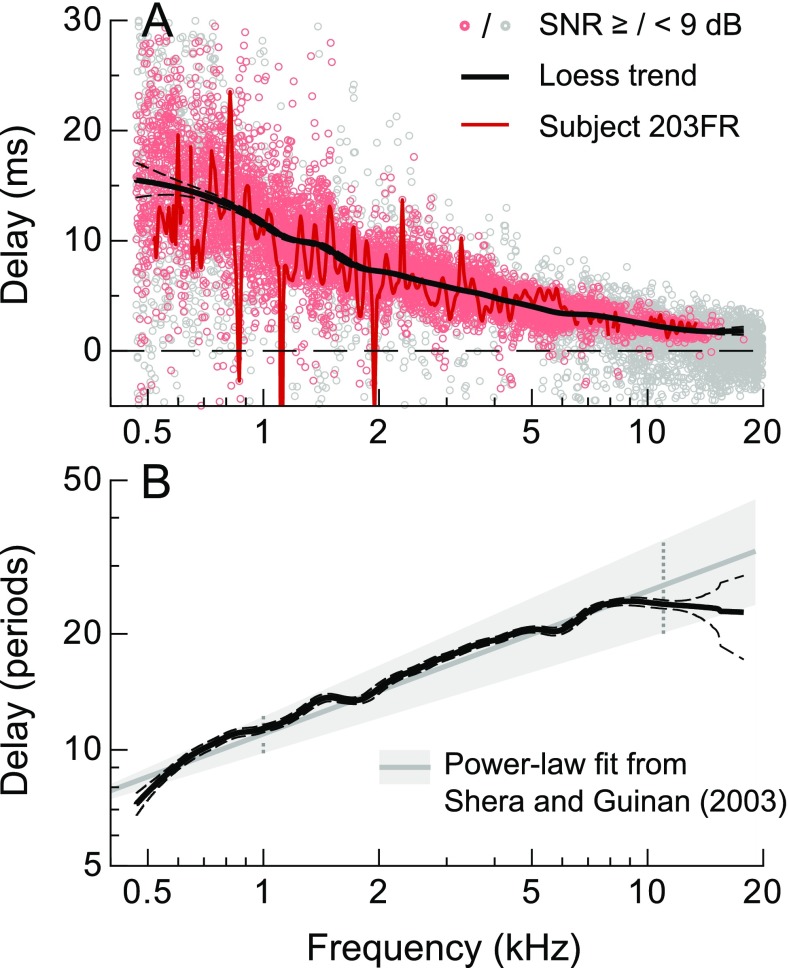
FIG. 3.
A SFOAE phase-gradient delays calculated from the data in Figure 2. The solid/dashed lines indicate the mean and 95 % CI for the robust loess fit (span = 0.2) to all data with SNR ≥ 9 dB (red symbols; gray symbols indicate SNR < 9 dB). Delays from a representative ear are shown with the red line (only data with SNR ≥9 shown for clarity), illustrating that the large variation in the group data was primarily due to quasiperiodic fluctuations with frequency observed in individual ears. B Mean and 95 % CI for the robust loess fit to the delays expressed in stimulus periods (solid and dashed lines). Also shown is the power-law fit provided by Shera and Guinan (2003), which was based on data extending to slightly lower frequencies (gray line, shaded area indicates the 95 % CI). The dashed vertical lines at 1 and 11 kHz indicate the frequency range of the data used to derive the power-law fit.

