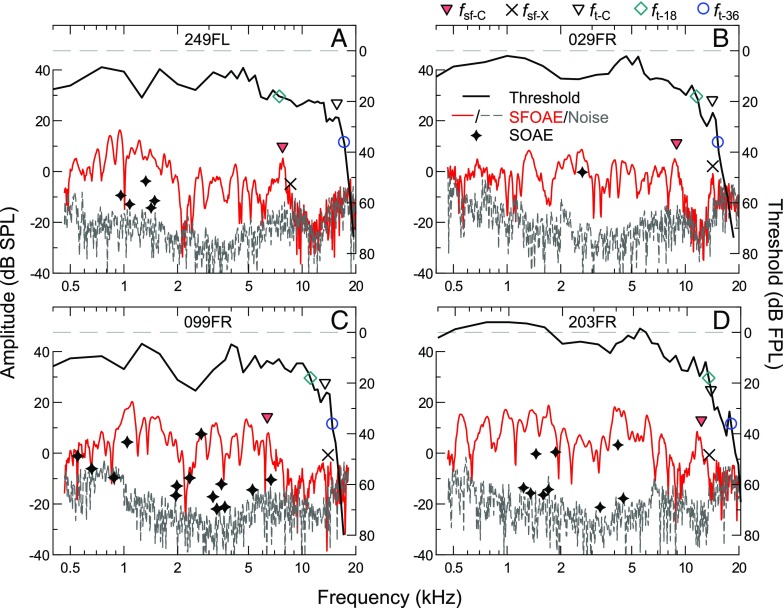
FIG. 5.
Individual thresholds (black lines) and SFOAE amplitudes/noise floors (red/dashed gray lines) for four subjects (A–D), demonstrating the diversity of SFOAE responses at high frequencies. SOAE frequencies and amplitudes are indicated by stars. As described in the main text, threshold and SFOAE corner frequencies (f t-C and f sf-C) were determined and are marked with open and filled triangles, respectively. Also indicated is the last frequency where the SFOAE SNR was at least 9 dB within a 1/9th-octave span (f sf-X; x’s), as well as the 18- and 36-dB FPL threshold intercepts (f t-18 and f t-36; open diamonds and circles, respectively). These threshold and SFOAE “landmark” frequencies are compared in Figure 6.

